
Short Table of Contents
- Introduction
- Why Choose Capital Street FX?
- What Are Technical Indicators?
- Top 5 Technical Indicators
- Moving Averages
- RSI
- Bollinger Bands
- MACD
- Fibonacci Retracement
- Combining Technical Indicators
- Capital Street FX for Expert Traders
- Common Mistakes with Indicators
- Practical Tips for Using Indicators
- Conclusion
- FAQs
Introduction

Success in trading often hinges on the ability to analyze market trends and make data-driven decisions. Technical indicators play a pivotal role in this process, offering traders a reliable way to interpret price movements, momentum, and market sentiment.
For expert traders, choosing the right platform is just as important as mastering indicators. Capital Street FX stands out as a premier broker for professional traders, offering access to over 400 trading instruments, including forex, stocks, commodities, and indices. Combined with its advanced tools, it’s a perfect choice for those seeking to refine their trading strategies.
Let’s dive into the five essential technical indicators that every trader must know.
Why Choose Capital Street FX as an Expert Trader?
A robust platform like Capital Street FX can make all the difference when it comes to trading.
- Extensive Range of Instruments
- Capital Street FX has over 400+ trading instruments and allows traders to diversify their portfolios and seize opportunities across global markets.
- Advanced Trading Tools
- Expert traders benefit from high-grade analytical tools, live charting systems, and seamless order execution.
- Unparalleled Support for Professionals
- The platform offers resources tailored to advanced strategies, helping traders stay ahead of the curve.
Capital Street FX provides the features necessary to excel, whether trading forex or exploring commodities.
What Are Technical Indicators?
Technical indicators are mathematical calculations based on historical price, volume, or open interest data. They serve as tools for traders to predict market movements and identify trading opportunities.
- Purpose: They simplify complex market trends into actionable insights.
- Types: Momentum indicators, trend-following indicators, and volatility indicators are among the most commonly used.
By mastering these tools, traders can build a structured approach to trading rather than relying on intuition.
Visit – Our Daily Technical Analysis Report
Top 5 Technical Indicators Every Trader Should Know
1. Moving Averages (MA)
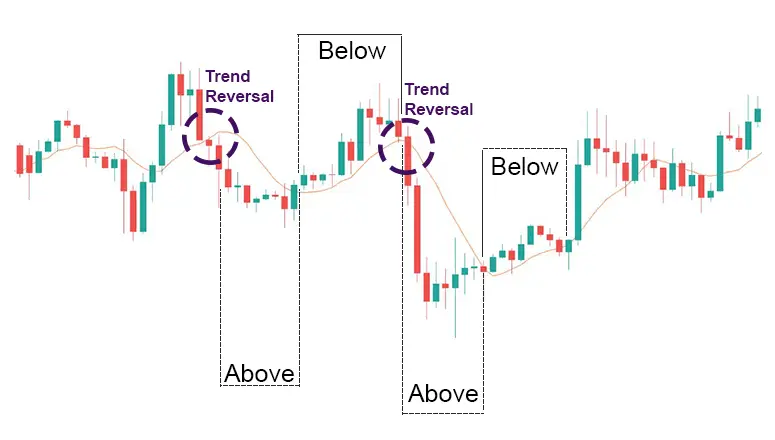
Moving averages smooth out price data to reveal underlying trends.
- Simple Moving Average (SMA): Averages prices over a set period, providing a baseline for analysis.
- Exponential Moving Average (EMA): Gives more weight to recent data, making it more reactive to market changes.
How to Use:
- Identify long-term trends with SMA and short-term trends with EMA.
- Combine multiple MAs to spot golden crosses (bullish signal) or death crosses (bearish signal).
2. Relative Strength Index (RSI)
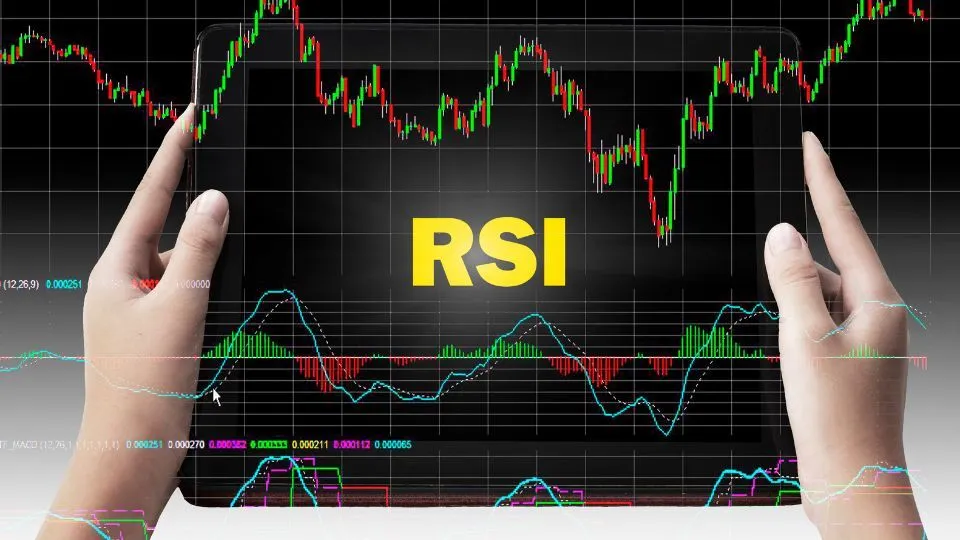
The RSI measures the speed and change of price movements, operating on a scale from 0 to 100.
- Overbought Conditions: RSI above 70 signals a potential reversal.
- Oversold Conditions: RSI below 30 indicates a buying opportunity.
Application:
- Use RSI divergences to spot weakening trends before reversals.
3. Bollinger Bands

Bollinger Bands consist of a moving average line flanked by two standard deviation lines, forming a channel around price movement.
Benefits:
- Measure market volatility: Narrow bands indicate low volatility, while wide bands suggest high volatility.
- Spot breakouts: Prices breaking above or below the bands can signal significant market moves.
4. Moving Average Convergence Divergence (MACD)
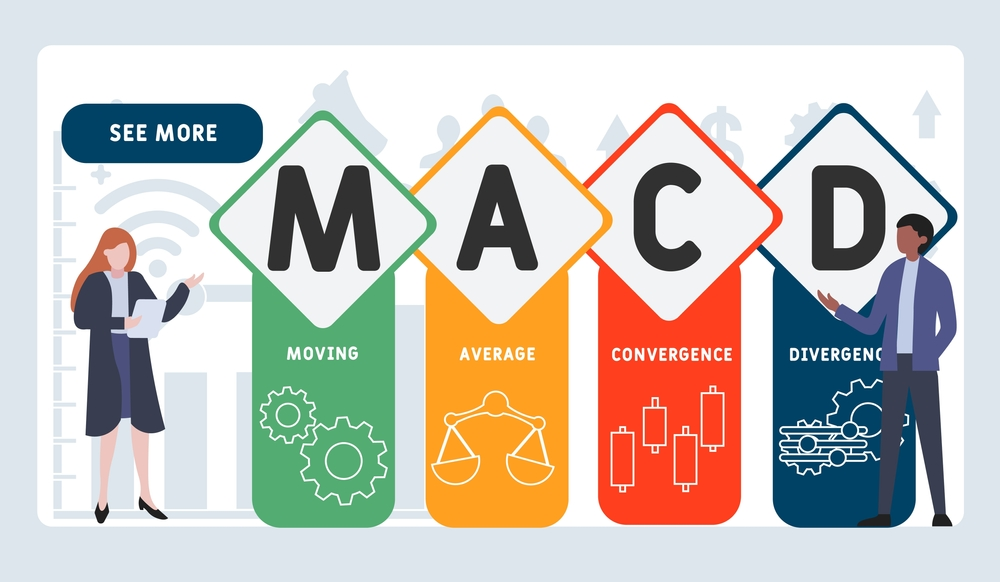
MACD combines moving averages to assess momentum and trend strength.
- Key Components:
- MACD Line
- Signal Line
- Histogram
Strategy:
- Use MACD crossovers to confirm trend reversals.
- Analyze the histogram to gauge the strength of ongoing trends.
5. Fibonacci Retracement
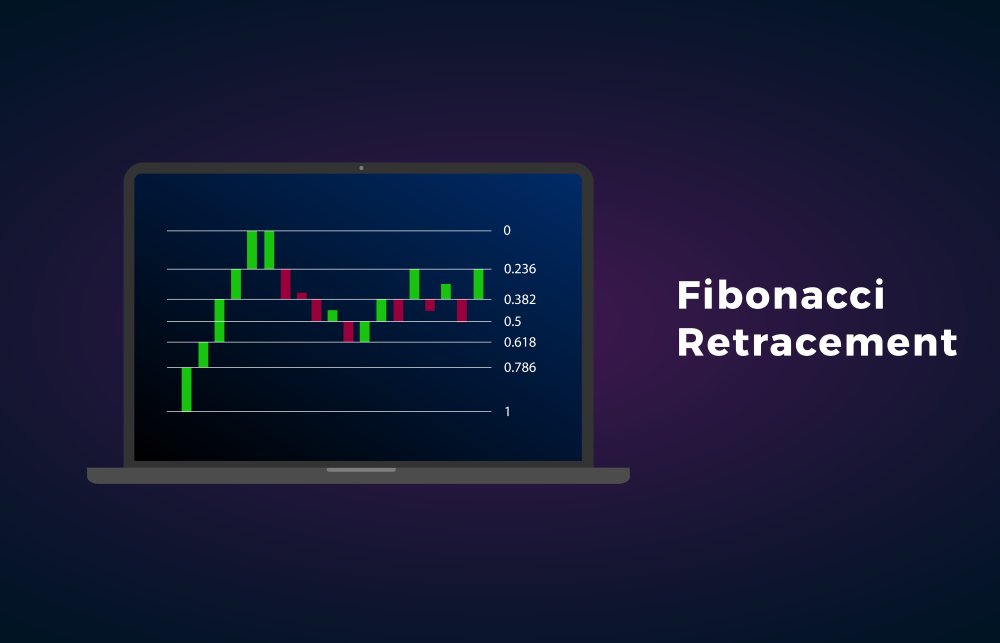
Fibonacci retracement is a tool that uses key levels derived from the Fibonacci sequence to identify potential reversal zones.
Key Levels:
- 23.6%, 38.2%, 50%, 61.8%, and 78.6%
How to Use:
- Place Fibonacci levels on a recent price move to identify support and resistance zones.
- Combine Fibonacci with other indicators like Bollinger Bands for precise entry points.
READ MORE – How to Choose the Best Trading Platform in 2025?
Combining Technical Indicators for Maximum Impact
Using multiple indicators together helps traders avoid false signals and increase accuracy.
- Example Strategy: Pair Bollinger Bands with RSI to confirm breakouts.
- Case Study: A trader uses MACD and Fibonacci levels to time market entries in a volatile forex pair.
How Capital Street FX Enhances Technical Analysis
Capital Street FX equips traders with state-of-the-art tools to make technical analysis seamless.
- Advanced Charting Features: Customize indicators and overlays to match trading strategies.
- Wide Range of Assets: Trade across markets with reliable access to technical data.
READ MORE – Top Trading Strategies for Expert Traders | A Complete Guide
Common Mistakes Traders Make with Indicators
Even seasoned traders can fall into common traps, such as:
- Overloading Charts: Using too many indicators creates conflicting signals.
- Neglecting Risk Management: No indicator can replace solid risk strategies.
- Ignoring Market Context: Indicators should always be interpreted in light of overall market trends.
Practical Tips for Using Technical Indicators Effectively
- Backtest Strategies: Always test your indicator-based strategies on historical data.
- Adapt to Market Conditions: Use different indicators for trending versus ranging markets.
- Stay Informed: Keep learning about new indicators and refine your methods over time.
READ MORE – Crude Oil Declines Amid Weak China Data and Euro Recovery
Conclusion
Mastering technical indicators is essential for traders looking to improve accuracy and profitability. Whether you’re tracking trends with moving averages or pinpointing reversals with Fibonacci retracements, these tools can transform your trading game.
With its wide range of instruments and cutting-edge tools, Capital Street FX stands out as a top choice for expert traders ready to leverage these indicators.