

Bitcoin and major cryptocurrencies experienced a downturn on Friday as risk sentiment soured due to escalating trade tensions and anticipation of key U.S. inflation data. Bitcoin (BTC) fell below $86,000, with Ethereum (ETH), Ripple (XRP), and Dogecoin (DOGE) also posting declines. Investors are closely monitoring crucial support levels and potential recovery signals across the crypto market.
KEY HIGHLIGHTS
- Bitcoin Falls Below $86K Amid Trade War Fears.
- Ethereum Drops Below $2K, Eyes Key Support Level.
- Ripple Faces Risk if 100-Day EMA Breaks.
- Dogecoin Holds Above $0.180 Despite Recent Pullback.
Bitcoin (BTC) Price Analysis
Bitcoin Price Dips Below $86K as Investors Brace for Tariffs and U.S. Inflation Data
Bitcoin declined on Friday as investor sentiment weakened amid mounting global trade tensions ahead of the U.S. reciprocal tariffs. Traders remained cautious ahead of the Personal Consumption Expenditures (PCE) price index release, a key inflation gauge influencing the Federal Reserve’s interest rate outlook. President Donald Trump’s recent announcement of a 25% tariff on foreign-manufactured cars and auto parts, set to take effect on April 2, has amplified fears of a global trade war, further weighing on risk assets like cryptocurrencies.
Technical Overview


Moving Averages (Exponential & Simple):
- EMA 10: 85,827 | Bearish
- EMA 20: 85,875 | Bearish
- EMA 50: 88,689 | Bearish
- SMA 10: 85,910 | Bearish
- SMA 20: 84,200 | Bullish
- SMA 50: 89,380 | Bearish
Indicators:
- RSI: 46.70 (Neutral)
- Stochastic Oscillator: 69.46 (Neutral)
Key Support & Resistance Levels:
- Resistance: R1: 97,945 | R2: 103,787
- Support: S1: 79,031 | S2: 73,189
Trade Suggestion:
- Limit Sell: 86,594
- Take Profit: 83,745
- Stop Loss: 88,747
Ethereum (ETH) Price Analysis
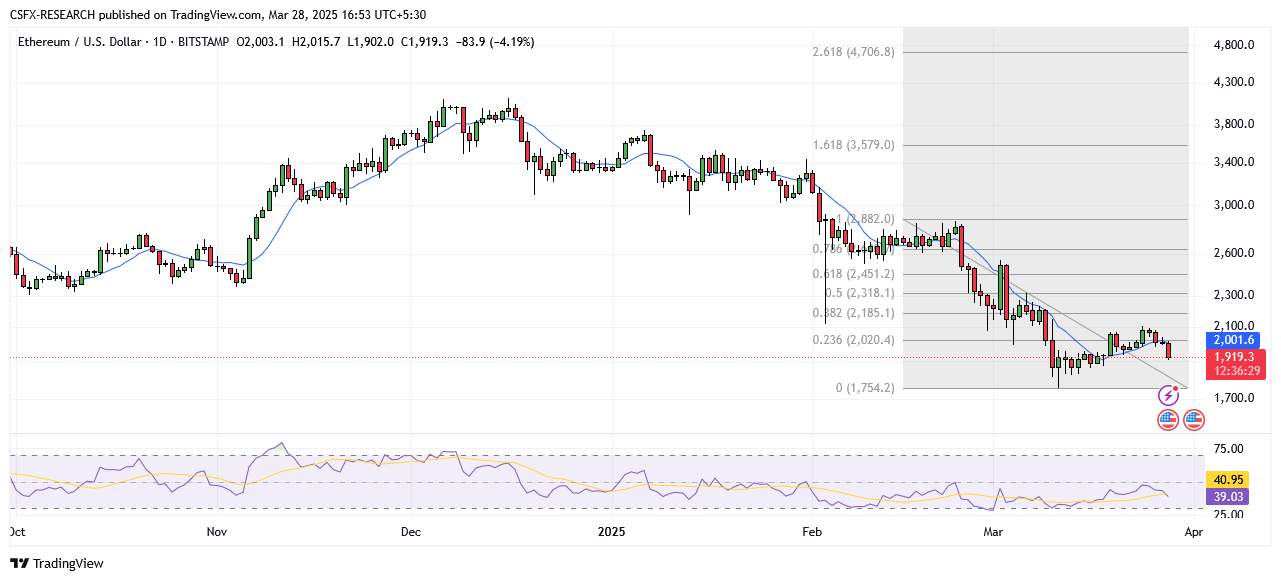
Ethereum Struggles Below $2,000, Eyes Key Support Levels
Ethereum saw a 3.73% pullback over the past three days, falling below $2,000. Despite rebounding nearly 7% last week, ETH remains under pressure as risk aversion grips the market. If the bearish momentum continues, Ethereum could retest the crucial $1,861 support level. On the upside, a strong recovery could push ETH toward its March 7 high of $2,258.
Technical Overview
Moving Averages (Exponential & Simple):
- EMA 10: 1,993 | Bearish
- EMA 20: 2,036 | Bearish
- EMA 50: 2,292 | Bearish
- SMA 10: 2,007 | Bearish
- SMA 20: 1,963 | Bearish
- SMA 50: 2,295 | Bearish
Indicators:
- RSI: 38.76 (Bearish)
- Stochastic Oscillator: 47.90 (Neutral)
Key Support & Resistance Levels:
- Resistance: R1: 3,028 | R2: 3,324
- Support: S1: 2,069 | S2: 1,773
Trade Suggestion:
- Limit Sell: 1,960.8
- Take Profit: 1,841.9
- Stop Loss: 2,058.8
Ripple (XRP) Price Analysis
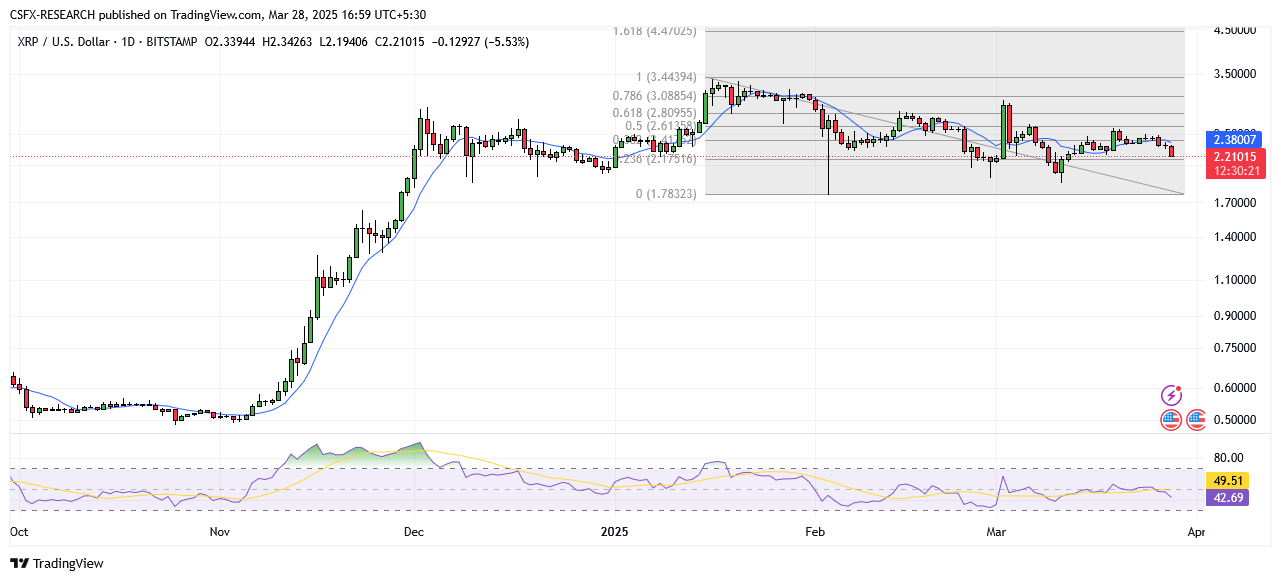
Ripple Faces Key EMA Support; Break Below $2.20 Could Trigger Further Declines
Ripple (XRP) climbed above its 100-day EMA at $2.32 last week, but a recent 5.74% decline has brought it back toward key support. If XRP closes below its 100-day EMA at $2.20, further downside toward $1.96 is possible. However, holding this support level could lead to a rebound targeting resistance at $2.72.
Technical Overview
Moving Averages (Exponential & Simple):
- EMA 10: 2.35 | Bearish
- EMA 20: 2.36 | Bearish
- EMA 50: 2.41 | Bearish
- SMA 10: 2.39 | Bearish
- SMA 20: 2.32 | Bearish
- SMA 50: 2.42 | Bearish
Indicators:
- RSI: 42.65 (Neutral)
- Stochastic Oscillator: 23.68 (Bearish)
Key Support & Resistance Levels:
- Resistance: R1: 2.82 | R2: 3.12
- Support: S1: 1.84 | S2: 1.54
Trade Suggestion:
- Limit Sell: 2.28
- Take Profit: 2.05
- Stop Loss: 2.47
Dogecoin (DOGE) Price Analysis
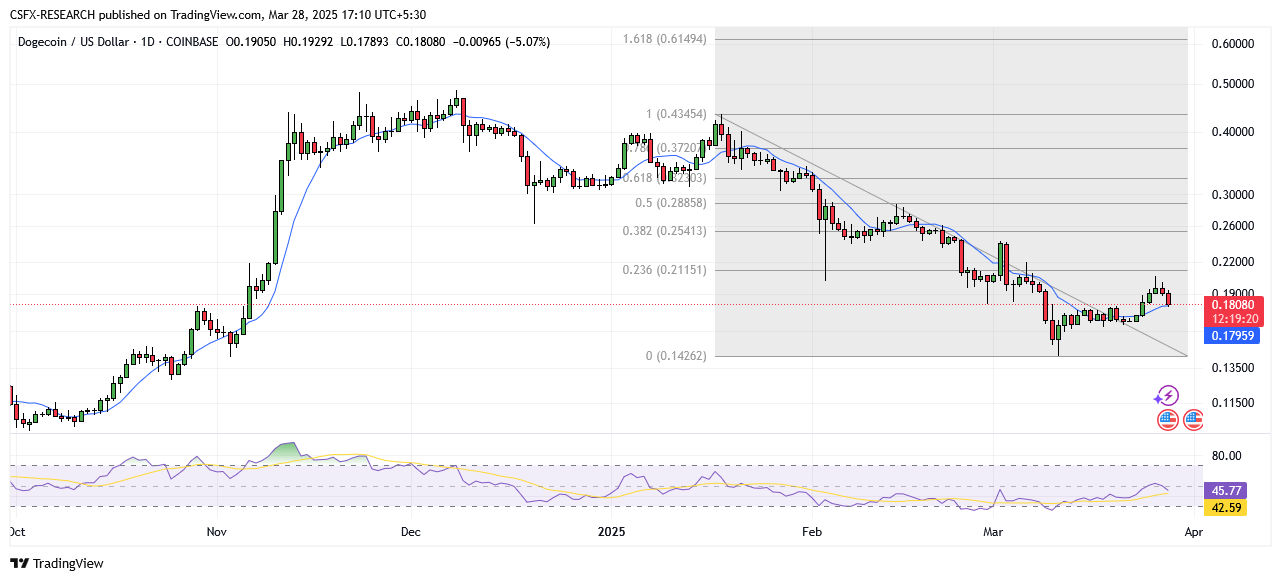
Dogecoin Pulls Back but Maintains Overall Uptrend
Dogecoin (DOGE) has declined by 4% in the past 24 hours but remains in a bullish structure. After hitting $0.2050, DOGE retraced and is currently testing the $0.180 support level. Holding above this level could lead to a recovery, with resistance at $0.1920. A break below $0.1750, however, may signal further losses.
Technical Overview
Moving Averages (Exponential & Simple):
- EMA 10: 0.181 | Bearish
- EMA 20: 0.183 | Bearish
- EMA 50: 0.212 | Bearish
- SMA 10: 0.179 | Bullish
- SMA 20: 0.173 | Bullish
- SMA 50: 0.209 | Bearish
Indicators:
- RSI: 45.76 (Neutral)
- Stochastic Oscillator: 60.36 (Neutral)
Key Support & Resistance Levels:
- Resistance: R1: 0.295 | R2: 0.331
- Support: S1: 0.180 | S2: 0.145
Trade Suggestion:
- Limit Buy: 0.176
- Take Profit: 0.205
- Stop Loss: 0.164
Crypto Market Overview
- Bitcoin (BTC) down 2.48% at 85,049
- Ethereum (ETH) down 5.28% at 1,897.55
- Litecoin (LTC) down 0.1% at 92.26
- Solana (SOL) down 5.09% at 131.31
- Dogecoin (DOGE) down 4.98% at 0.181
Key Economic Events Today
- GBP GDP (QoQ) (Q4): Forecast 0.1%, Previous 0.0% (12:30 PM GMT)
- GBP GDP (YoY) (Q4): Forecast 1.4%, Previous 0.9% (12:30 PM GMT)
- USD Core PCE Price Index (MoM) (Feb): Forecast 0.3%, Previous 0.3% (6:00 PM GMT)
- USD Core PCE Price Index (YoY) (Feb): Forecast 2.7%, Previous 2.6% (6:00 PM GMT)
- CAD GDP (MoM) (Jan): Forecast 0.2%, Previous 0.2% (6:00 PM GMT)