

KEY HIGHLIGHTS
- Gold steadies as US PPI release approaches cautiously.
- Silver struggles near resistance, bearish momentum persists cautiously.
- WTI crude oil dips, pauses multi-day bullish rally.
- Natural gas retreats after surge driven by cold weather.
INTRODUCTION
Global commodity markets experience mixed movements as WTI crude oil pulls back from a multi-month high and natural gas futures retreat amid resistance levels. Geopolitical factors, weather-driven demand, and supply concerns continue to drive market sentiment. Traders are focused on technical indicators and economic data releases to gauge future price trajectories.
WTI Crude Oil Dips From Recent Highs
WTI crude oil prices dipped slightly on Tuesday, trading near $77.50 after reaching their highest level since October 8 during a three-day rally. Despite the pullback, the overall market sentiment remains bullish, supported by supply concerns and potential policy shifts.
The U.S. Treasury Department recently implemented stricter sanctions on Russia’s oil industry, targeting nearly 200 vessels in the shadow tanker fleet. This move has raised fears of a tighter global supply. Additionally, speculation surrounding stricter sanctions on Iranian oil under the Trump administration adds to the positive outlook for crude prices.
Resilient U.S. economic data, coupled with expectations of expansionary policies, signal potential growth in fuel demand. However, the ongoing correction in the U.S. Dollar (USD) and profit-taking by traders have contributed to the current dip in oil prices.
Technical Overview:

- Exponential Moving Averages:
- MA 10: $75.22 | Positive Crossover | Bullish
- MA 20: $73.36 | Positive Crossover | Bullish
- MA 50: $71.69 | Positive Crossover | Bullish
- RSI: 75.03 | Buy Zone | Bullish
- Resistance and Support Levels:
- R1: $72.21 | R2: $73.40
- S1: $68.36 | S2: $67.17
Trade Suggestion:
- Limit Buy: $76.09
- Take Profit: $79.33
- Stop Loss: $74.33
Natural Gas Retreats Below Key Resistance
Natural gas futures surged earlier, driven by Arctic cold weather and record LNG exports, but prices pulled back below the $4.201 resistance level. The initial rally, which saw prices reach $4.369, was fueled by increased heating demand due to freezing temperatures and robust export activity.
However, traders remain cautious as natural gas inventories currently stand at a surplus of 3,373 Bcf. This surplus could diminish rapidly if cold weather and export demand persist. Resistance at $4.201 continues to cap gains, indicating a more cautious market sentiment.
Technical Overview:

- Exponential Moving Averages:
- MA 10: $3.75 | Positive Crossover | Bullish
- MA 20: $3.59 | Positive Crossover | Bullish
- MA 50: $3.24 | Positive Crossover | Bullish
- RSI: 58.17 | Buy Zone | Bullish
- Resistance and Support Levels:
- R1: $4.14 | R2: $4.49
- S1: $3.02 | S2: $2.67
Trade Suggestion:
- Limit Buy: $3.71
- Take Profit: $4.09
- Stop Loss: $3.49
Gold Holds Steady Amid Mixed Signals
Gold prices showed a positive bias on Tuesday but struggled to gain sustained momentum ahead of the U.S. Producer Price Index (PPI) release. The metal traded within the $2,669-$2,670 range, supported by a pullback in U.S. Treasury yields and a weaker USD.
Improved investor confidence, driven by reduced fears of disruptive trade policies, capped demand for safe-haven assets like gold. Additionally, robust U.S. Nonfarm Payrolls data dampened expectations of aggressive Federal Reserve rate cuts, further limiting upside potential.
Technical Overview:
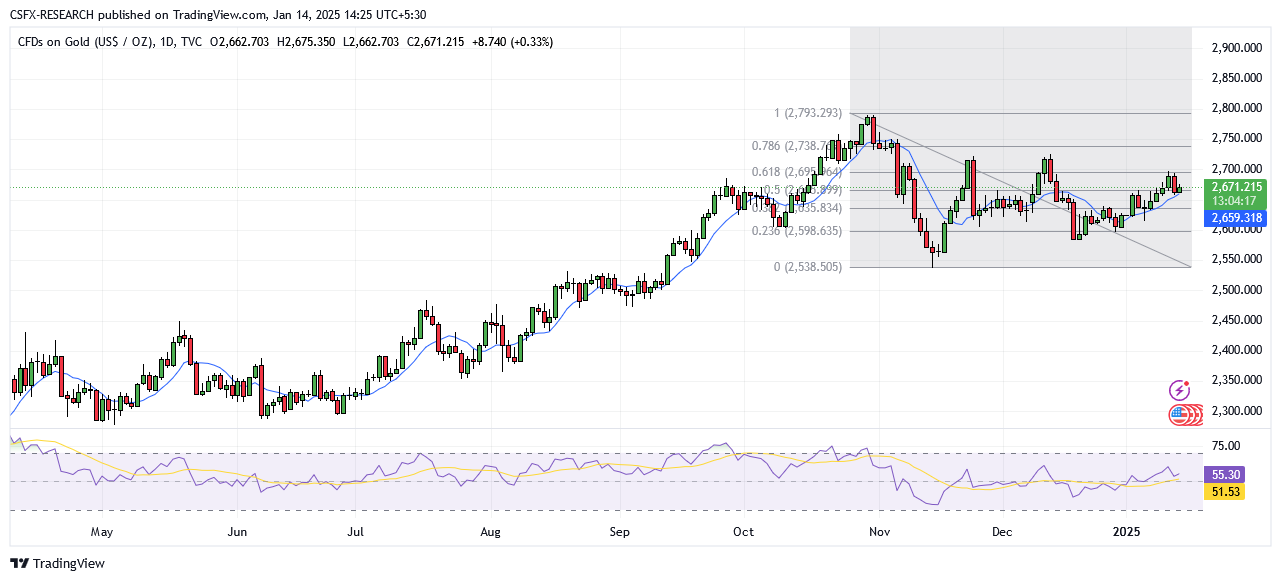
- Exponential Moving Averages:
- MA 10: $2,658.24 | Positive Crossover | Bullish
- MA 20: $2,649.75 | Positive Crossover | Bullish
- MA 50: $2,643.46 | Positive Crossover | Bullish
- RSI: 55.41 | Buy Zone | Bullish
- Resistance and Support Levels:
- R1: $2,699.06 | R2: $2,732.79
- S1: $2,589.87 | S2: $2,556.14
Trade Suggestion:
- Limit Buy: $2,661.69
- Take Profit: $2,698.45
- Stop Loss: $2,639.49
Silver Struggles to Break Key Resistance
Silver prices edged higher during Tuesday’s Asian session but faced resistance around the $29.65 level. The metal remains vulnerable to further downside, with mixed technical signals indicating caution.
Silver’s recent recovery from the $28.80-$28.75 zone has stalled near the $30.00 psychological level, which serves as immediate resistance. A decisive break above $30.00 could shift the near-term bias to favor bulls, while a failure to do so may lead to further declines.
Technical Overview:
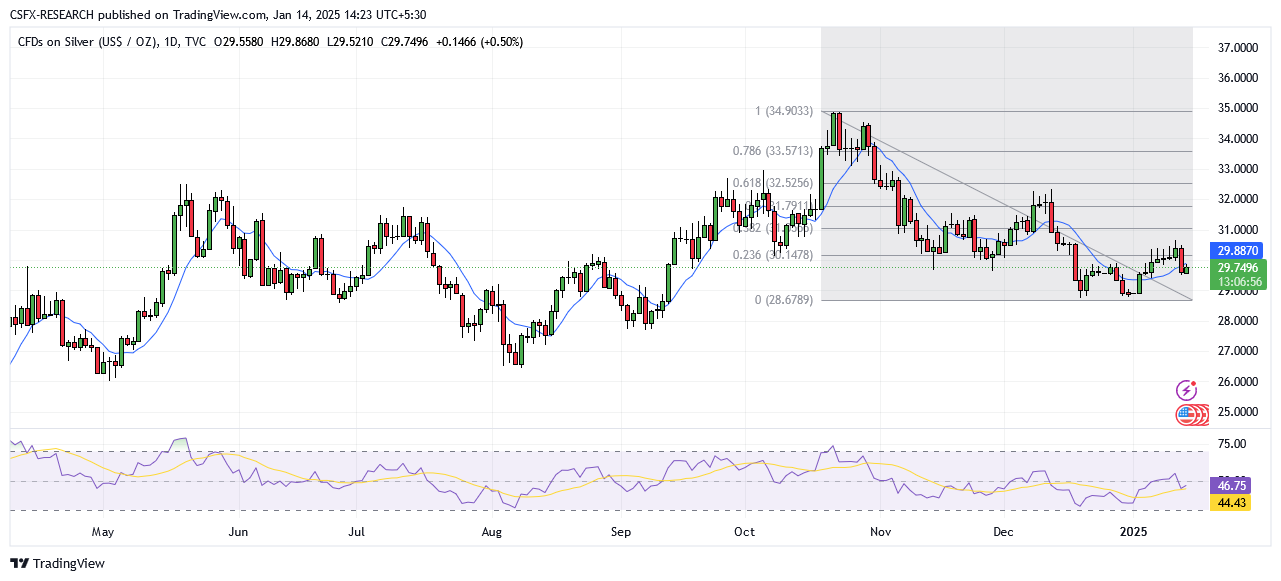
- Exponential Moving Averages:
- MA 10: $29.80 | Positive Crossover | Bullish
- MA 20: $29.89 | Negative Crossover | Bearish
- MA 50: $30.34 | Negative Crossover | Bearish
- RSI: 45.86 | Neutral Zone | Neutral
- Resistance and Support Levels:
- R1: $30.05 | R2: $31.71
- S1: $28.83 | S2: $27.61
Trade Suggestion:
- Limit Sell: $30.00
- Take Profit: $28.68
- Stop Loss: $30.98
Conclusion
The commodity market remains highly dynamic, with WTI crude oil and natural gas taking center stage due to geopolitical tensions and weather-driven demand. Gold and silver continue to navigate mixed signals, reflecting broader uncertainties. Traders should monitor key economic indicators and resistance levels to position themselves strategically in the evolving market landscape.