

AUD/USD Slumps to Near Two-Month Low of 0.6500 Ahead of US/China CPI Data.
Introduction
In the dynamic landscape of global economics, the Australian dollar has faced a significant setback, plummeting to a near two-month low of 0.6500. This decline can be attributed to the robustness of the US dollar and China’s decelerating economic growth. As these market forces intertwine, the AUD/USD pair encounters a formidable challenge, leading to its downward spiral. This article delves into the fundamental factors driving this trend, explores the technical analysis behind the AUD/USD movement, and provides insights into potential trading strategies amidst these fluctuations.
Fundamental Overview
The Australian dollar’s descent to 0.6500 has been influenced by a confluence of factors. The strength of the US dollar, coupled with China’s sluggish economic expansion, has contributed to this downward trajectory. The United States is poised to witness an annualized headline inflation rise from 3.0% to 3.3%, signifying a potential economic shift. Meanwhile, the Chinese economy grapples with internal demand deficiencies and vulnerable exports, impeding its ability to elevate inflation levels.
The Impact on AUD/USD
The AUD/USD pair faces a challenging environment characterized by the strengthening US Dollar Index (DXY) and the waning vigor of China’s trade relations. The Australian currency’s value has plunged to a two-month nadir around 0.6500, with projections indicating a further decline. This apprehension is rooted in the anticipation of a bustling economic calendar and heightened cautiousness among investors.
The Upcoming US CPI Data
Market sentiment experiences a ripple effect as S&P;500 futures extend losses during the European session. This cautious stance emerges ahead of the release of US Consumer Price Index (CPI) data. The US Dollar Index escalates past the 102.40 threshold, influenced by the prospect of tenacious July CPI data due to the revival of global oil prices. The potential rise in oil prices may trigger increased gasoline expenses, causing the mitigating impact of cheap oil on headline price pressures to diminish.
The Rebalancing of Inflation
Forecasts indicate a return of annualized headline inflation to 3.3%, surpassing the previous 3.0% mark. This projection carries implications for the Federal Reserve’s interest rate decisions, potentially defying expectations of rate hikes before the year concludes. As investors await this crucial data, their focus also shifts to China’s inflation statistics, set to be unveiled. The monthly Consumer Price Index is predicted to remain stable, resisting a 0.2% deflation. On an annual basis, a 0.5% decrease in inflation is anticipated.
China’s Struggle with Inflation
China grapples with the paradox of weak internal demand and susceptible exports, leading to a persistent struggle in boosting inflation despite fiscal and monetary stimuli. Notably, Australia’s status as China’s primary trading partner underscores the ripple effect of China’s economic prospects on the Australian Dollar.
AUD/USD Technical Analysis Daily Chart
Technical Overview
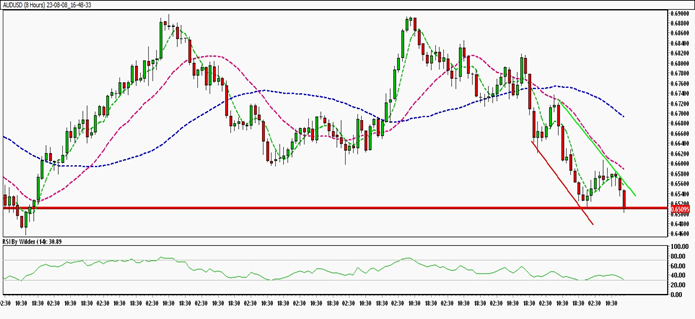
The technical landscape of the AUD/USD unfolds on a daily chart, revealing insightful patterns. The currency pair operates within a discernible down channel, signifying its current trajectory. Positioned below all Simple Moving Averages (SMA), the AUD/USD reflects a bearish sentiment. The Relative Strength Index (RSI) charts its course within the selling zone, corroborated by the Stochastic oscillator’s indication of a downtrend.
Immediate Support and Resistance Levels
As the AUD/USD navigates this complex terrain, its immediate resistance level stands at 0.6523. Conversely, the currency finds a foundational support level at 0.6503. These thresholds shape the boundaries within which the AUD/USD movement unfolds.
Trading Insights: Navigating the AUD/USD Landscape
Navigating Market Dynamics
Following a robust ascension, the AUD/USD confronts resistance and initiates a reversal towards the downside. This shift is characterized by a recurring lower-low pattern, underscoring the currency pair’s prevailing downtrend. Presently, the AUD/USD resides within a support zone; a breach of this zone could trigger a further descent.
Trade Suggestion
Informed by this comprehensive analysis, a potential trading strategy emerges. A sell signal emanates from the AUD/USD’s trajectory, prompting consideration for a trading entry at 0.6495. A prudent take-profit target at 0.6470 is complemented by a stop-loss measure at 0.6516, effectively managing risk within this volatile environment.
Conclusion
In the intricate realm of global economics, the AUD/USD pair navigates a tumultuous path, driven by the dynamics of the US dollar’s strength and China’s economic challenges. This article has elucidated the fundamental factors influencing this journey, dissected the technical landscape, and offered valuable insights for trading strategies. As investors tread cautiously amidst this volatile climate, understanding the intricate interplay between market forces is paramount.
FAQs
Why has the AUD/USD slumped to 0.6500?
The AUD/USD’s decline can be attributed to the potency of the US dollar and China’s decelerating economic growth.
What is the impact of US CPI data on AUD/USD?
The release of US Consumer Price Index (CPI) data fuels cautious sentiment, impacting the AUD/USD pair.
Why is China struggling with inflation?
China grapples with weak internal demand and vulnerable exports, hindering efforts to elevate inflation levels.
How does China’s economic situation affect the Australian Dollar?
As China’s largest trading partner, Australia experiences the repercussions of China’s economic prospects on its currency.