

BTC/USD TECHNICAL ANALYSIS: WEEKLY CHART
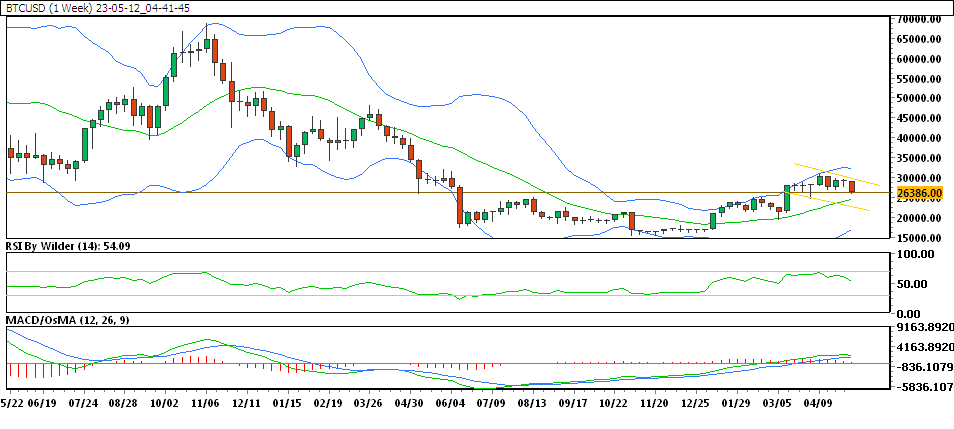
In the weekly chart, BTC/USD is trading in the down channel.
BTC/USD is currently trading above 20&50 SMA.
RSI is in buying zone, which shows bullishness. Stochastic is suggesting a downtrend.
Its immediate support is at 26516 & the resistance is at 27010
The price of BTC/USD was rising until the trend changed, a bearish engulfing formed at the area of resistance, and the price began sliding. Currently, the price has broken the previous week low and is trading at the support zone; if it breaks, more declines to the downside are expected.
BTC/USD TECHNICAL ANALYSIS: DAILY CHART
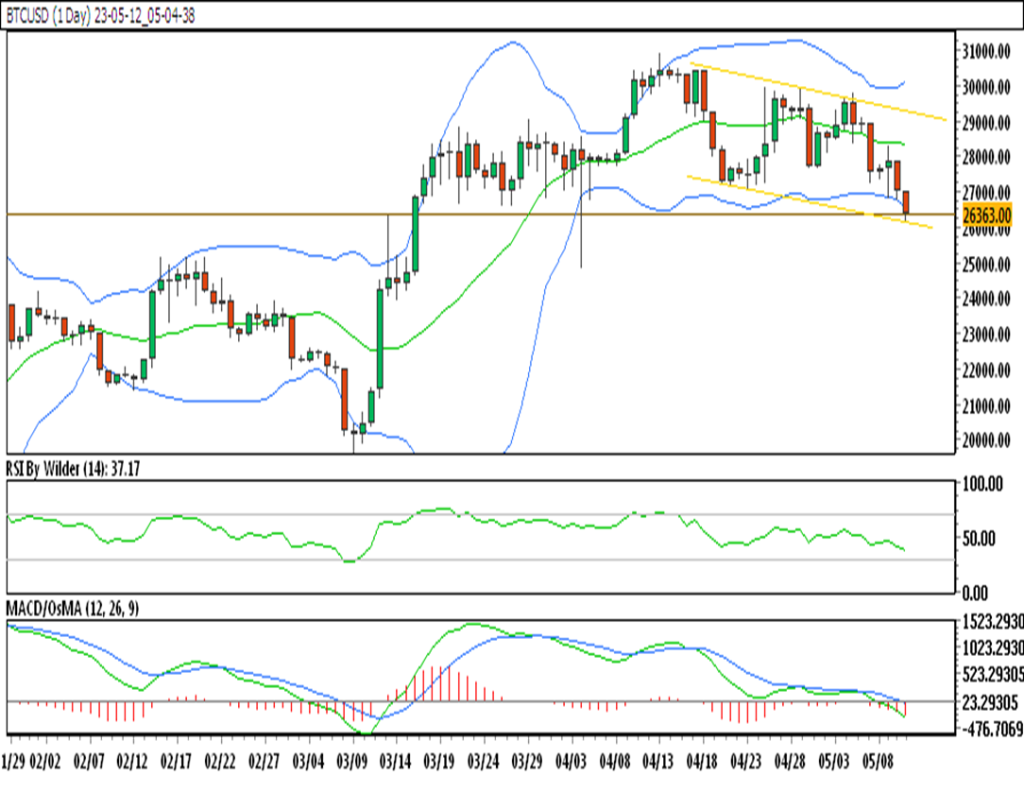
In the daily chart, BTC/USD is trading in down channel.
BTC/USD is currently trading below all SMA.
RSI is in buying zone, which shows bullishness. Stochastic is suggesting down trend.
Its immediate support is at 26579 & the resistance is at 27040
The price of BTC/USD was rising until the trend changed, a bearish engulfing formed at the area of resistance, and the price began sliding. Currently, the price has broken previous day low and is trading at the support zone; if it breaks, more declines to the downside are expected.