

Cadbury Old Technical Analysis: Weekly Chart
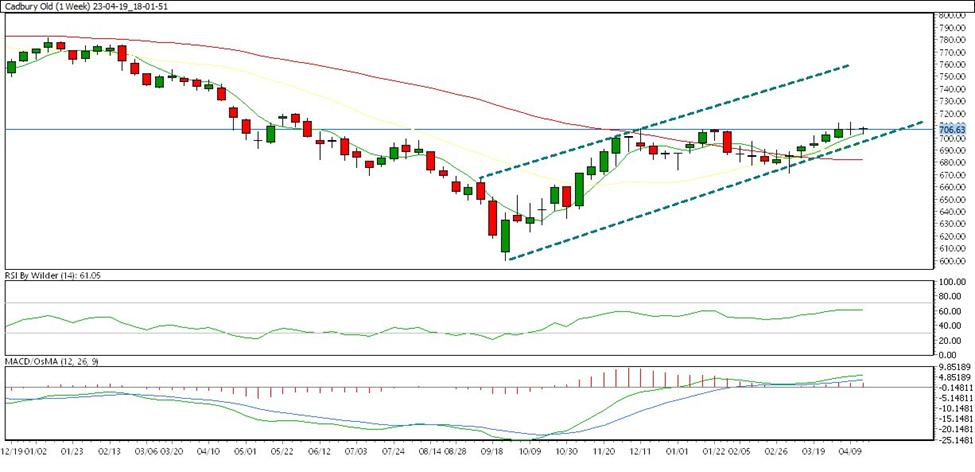
In the weekly charts, Cadbury Old is trading in an up channel. Cadbury Old is currently trading above all SMA.
RSI is in the neutral zone which indicates naturalness. MACD is currently above zero which indicates bullishness.
Its immediate support is 690.00 the resistance level is at 730.00
Cadbury Old will trade in an up channel until there is a trend reversal.
Cadbury Old Technical Analysis: Daily Chart
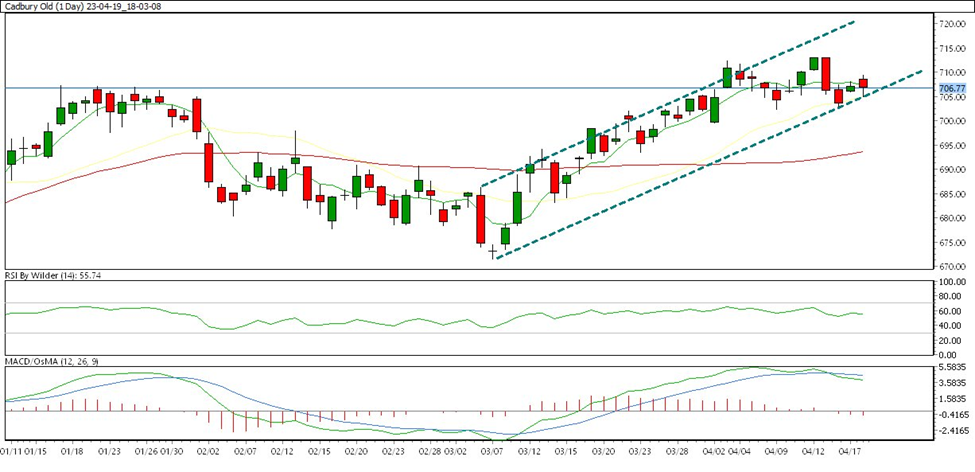
In the daily charts, Cadbury Old is trading in an up channel. Cadbury Old is currently trading above all SMA except MA (5).
RSI is in the selling zone which indicates bearishness. MACD is currently below zero which indicates bearishness.
Its immediate support is 690.00 the resistance level is at 720.00
Cadbury Old will trade in an up channel until a trend is reversed.
How to Trade Cadbury Old this Week:
Cadbury Old will follow the uptrend until its trend reversal. So, remain bullish on Cadbury Old