

Dow Jones Futures Decline Before Important Economic Data
Introduction
As the stock market prepares for an early closure in observance of the Fourth of July vacation, Dow Jones futures experienced a decline in mixed trading on Monday. Tesla, the electric car company led by Elon Musk, made headlines with an impressive 83% increase in deliveries during the second quarter, causing its stock to surge. In the coming days, investors eagerly await key economic data that will shape market sentiment.
The Labour Department’s Friday Jobs Report
The Labour Department’s highly anticipated jobs report, scheduled for release on Friday, takes center stage this week. Economists predict a gain of nearly 200,000 jobs, coupled with a decline in the unemployment rate to 3.6%. The data from this report will offer valuable insights into the health of the labor market and its impact on the overall economy.
S&P Global Purchasing Manager’s Manufacturing Index (PMI) for June
On Monday, market participants await the release of the S&P Global Purchasing Manager’s Manufacturing Index (PMI) for June. Wall Street projects the PMI to register at 46.3, consistent with the mid-month projection. Investors will analyze this data point to gauge the performance of the manufacturing sector and its implications for economic growth. The PMI figures are scheduled to be released at 9:45 a.m. ET.
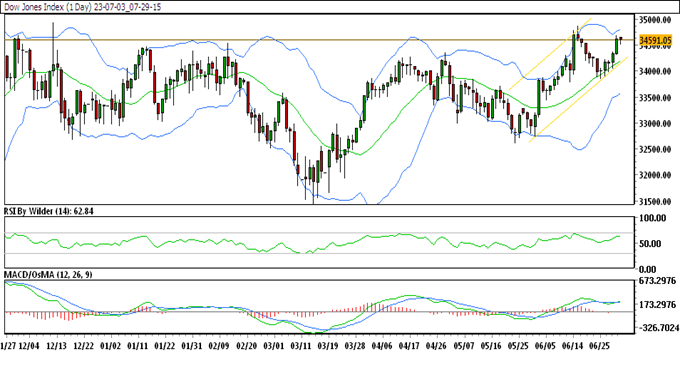
Dow Jones Technical Analysis Daily Chart
Dow Jones Trading Pattern
Analyzing the daily chart of the Dow Jones Industrial Average reveals a trading pattern characterized by an upward channel. Currently, the index is trading within this channel, suggesting a positive trend in the market.
Moving Averages and Bullish Signals
Furthermore, the Dow Jones index is trading above all Simple Moving Averages (SMA), indicating a favorable outlook. The Relative Strength Index (RSI) is situated in the buying zone, signaling bullish sentiment among investors. Moreover, the Stochastic indicator also suggests an upward trend in the market.
Support and Resistance Levels
The immediate resistance level for the Dow Jones index is at 34,665.21, while the immediate support level stands at 34,519.48. These key levels will play a significant role in determining the index’s future trajectory.
How to Trade Dow Jones This Week
After experiencing rapid gains, the price of the Dow Jones index recently faced a slight decline before resuming its ascent. Presently, it is trading near a critical resistance level. If this level is surpassed, it could potentially pave the way for further upside momentum. Traders and investors should carefully monitor the price action to capitalize on potential opportunities.
Trade Suggestion
For traders considering positions in the Dow Jones index, a potential strategy could be to buy at 34,388.80, set a target at 34,581.54, and establish a stop-loss level at 34,232.46. This trade suggestion aligns with the current market dynamics and offers a risk-management approach.
Conclusion
As Dow Jones futures experience a decline amidst mixed trading, investors eagerly await the Labour Department’s jobs report and the release of the PMI for June. These key economic indicators will provide valuable insights into the state of the labor market and manufacturing sector, shaping market sentiment. Traders should closely analyze technical factors, such as the Dow Jones index’s trading pattern, moving averages, and support/resistance levels, to make informed trading decisions. By combining fundamental and technical analysis, market participants can navigate the evolving landscape with confidence.
Frequently Asked Questions (FAQs)
Q: What is the significance of the Labour Department’s jobs report?
A: The jobs report provides crucial information on employment trends and the health of the labor market, influencing investor sentiment and economic forecasts.
Q: What does the S&P Global Purchasing Manager’s Manufacturing Index indicate?
A: The PMI offers insights into the manufacturing sector’s performance, serving as an indicator of economic growth and business activity.
Q: Why are support and resistance levels important for traders?
A: Support and resistance levels help traders identify potential entry and exit points, offering valuable guidance for decision-making.
Q: How can technical analysis aid in trading decisions?
A: Technical analysis enables traders to analyze historical price patterns and indicators to predict future price movements and make informed trading choices.