

ETH/USD WEEKLY SCENARIO
ETH/USD TECHNICAL ANALYSIS: WEEKLY CHART
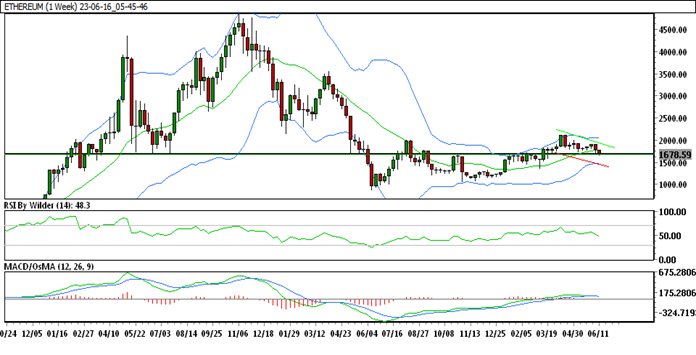
In the weekly chart, ETH/USD is trading in the down channel.
ETH/USD is currently trading below 5&20 SMA.
RSI is in buying zone, which shows bullishness. Stochastic is suggesting a downtrend.
Its immediate support is at 1671.31 & the resistance is at 1782.53
ETH/USD is trading in a down channel on the weekly chart. Price initially attempted to move upward, but it was unable to do so and turned around. Currently, the price has broken the previous week’s low and is trading at a key support level; if this level is broken, further decline is expected.
ETH/USD TECHNICAL ANALYSIS: DAILY CHART
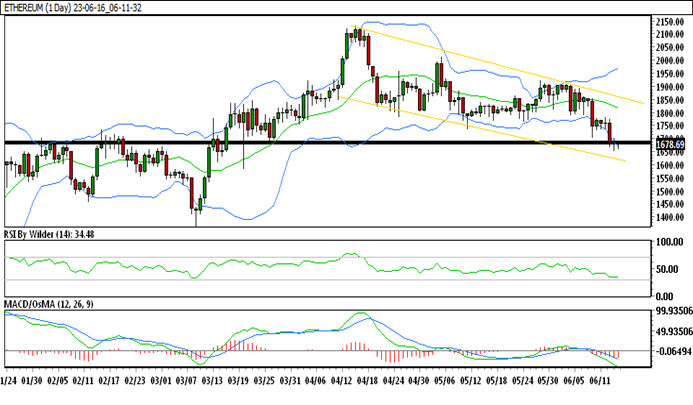
In the daily chart, ETH/USD is trading in the down channel.
ETH/USD is currently trading below all SMA.
RSI is in the selling zone, which shows bearishness. Stochastic is suggesting a downtrend.
Its immediate support is at 1681.18 & the resistance is at 1702.42