

Ethereum Prepares for a Significant Breakout
FUNDAMENTAL OVERVIEW:
Ethereum sellers have faced persistent challenges in breaking below the critical $3,000 support level for months, while recent price movements indicate a potential bullish recovery.
However, ETH remains trapped between the 100-day moving average at $3,300 and the 200-day moving average at $3,000. A clear breakout from this range will dictate the cryptocurrency’s next major direction.
Ethereum has been consolidating after a period of selling pressure, with sellers attempting to break the critical $3,000 support level. The asset remains range-bound between the 100-day moving average at $3,300 and the 200-day moving average at $3,000.
Recently, ETH experienced strong buying interest near the $3,000 support zone, triggering a notable rebound. This reaction highlights the presence of buyers actively defending this key level.
Although ETH has begun to show signs of recovery, traders are watching closely for a potential breakout beyond its current trading range.
ETHEREUM TECHNICAL ANALYSIS DAILY CHART:
Technical Overview:
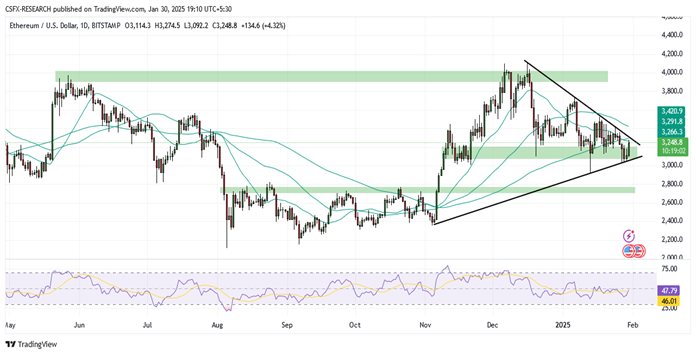
Ethereum is trading within a down channel.
Ethereum is moving below all the Moving Averages (SMA).
The Relative Strength Index (RSI) is in a Neutral Zone, while the Stochastic oscillator suggests a Positive trend.
Immediate Resistance level: 3288.6
Immediate support level: 3159.1
HOW TO TRADE ETHEREUM
On a higher time frame, Ethereum initially surged but encountered resistance, leading to a downside reversal. It is holding steady at a key support zone and forming a pattern resembling a Morning Star. If ETH maintains its upward momentum and breaks above the trendline, it could extend its rally further.
TRADE SUGGESTION- STOP BUY – 3300, TAKE PROFIT AT- 3520, SL AT- 3170.