

European stocks are experiencing a decline as investors exercise caution in anticipation of significant inflation data.
FUNDAMENTAL OVERVIEW:
European stock markets saw a decline on Tuesday, persisting in a restrained manner as they awaited the release of the week’s crucial inflation data.
This month, an improvement in risk sentiment occurred as data releases suggested a potential alleviation of inflation, raising expectations that central banks might have reached their highest points for interest rates.
Nevertheless, central bankers have been eager to emphasize caution, emphasizing that the battle to control inflation is not yet concluded.
In the midst of a generally challenging economic environment, the FTSE 100 index in the United Kingdom has recorded a slight year-over-year growth of 0.2%.
The FTSE 100’s tepid performance obscures the diverse outcomes among its constituent companies. Around half of the index’s stocks have displayed positive momentum, registering an average increase of 23.9%. In contrast, a slim majority have witnessed declines in their values, averaging at 12.8%.
FSTE 100 TECHNICAL ANALYSIS DAILY CHART:
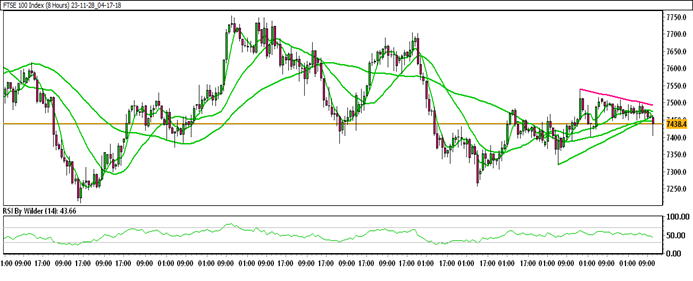
Technical Overview
FTSE 100 is currently trading within an up channel.
FTSE 100 is positioned below all Moving Averages (SMA).
The Relative Strength Index (RSI) is in the neutral zone, while the Stochastic oscillator suggests a negative trend.
Immediate Resistance level: 7515.9
Immediate support level: 7433.0
HOW TO TRADE FTSE 100
After experiencing an initial rise, the FTSE 100 encountered rejection, leading to a decline. Subsequently, it entered a consolidation phase within a certain range. Presently, the FTSE 100 has formed a double-top pattern and underwent a decline. It is currently trading within a support zone, and a breach of this support could potentially lead to further downside.
TRADE SUGGESTION- STOP SELL– 7416.1, TAKE PROFIT AT- 7320.1, SL AT- 7478.2.