

FTSE 100 Technical Analysis: Weekly Chart
Introduction
In this article, we will analyze the technical aspects of the FTSE 100 index, providing insights into its current trading patterns and potential future movements. By examining both the weekly and daily charts, we aim to offer valuable information for traders and investors.
FTSE 100 in a Down Channel
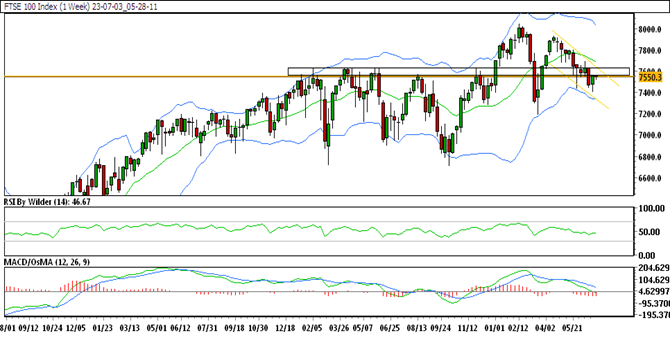
The weekly chart of the FTSE 100 reveals that the index is currently trading within a downward channel. This suggests a prevailing bearish trend in the market.
Trading Above 5&50 SMA
Despite the downward channel, the FTSE 100 is currently trading above its 5 and 50 Simple Moving Averages (SMA). This indicates a relatively positive stance in the market.
RSI Indicates Bullishness
The Relative Strength Index (RSI) for the FTSE 100 is in the buying zone, signaling a bullish sentiment among market participants. This further supports the notion of potential upward movement.
Stochastic Suggests Downtrend
However, the Stochastic indicator is suggesting a downtrend for the FTSE 100. This divergence between the RSI and Stochastic indicators indicates a degree of uncertainty in the market.
Support and Resistance Levels
The immediate support level for the FTSE 100 is identified at 7518.7, while the resistance level is at 7548.0. These levels play a crucial role in determining the potential price movements.
Attempting to Climb Upward
Following a significant downward movement, the FTSE 100 on the weekly chart has found support at its previous swing low and is currently attempting to climb upward. The price is currently hovering near a crucial resistance zone, and a break above this level could lead to further gains.
FTSE 100 Technical Analysis: Daily Chart
Down Channel Continues
When analyzing the daily chart of the FTSE 100, we observe that the index is still trading within the downward channel, indicating the persistence of the bearish trend.

Trading Below 20&50 SMA
Unlike the weekly chart, the FTSE 100 is now trading below its 20 and 50 Simple Moving Averages (SMA) on the daily chart. This suggests a weaker market sentiment in the short term.
RSI Shows Bullishness
Similar to the weekly analysis, the RSI on the daily chart also indicates bullishness as it remains in the buying zone. This implies a positive outlook despite the overall downtrend.
Stochastic Suggests Uptrend
Contrary to the stochastic indication on the weekly chart, the stochastic indicator on the daily chart suggests an uptrend for the FTSE 100. This discrepancy further adds to the market’s uncertainty.
Support and Resistance Levels
The immediate support level on the daily chart is identified at 7521.9, while the resistance level is at 7556.1. These levels should be closely monitored by traders as they can act as key turning points.
Attempting to Move Upside
Following a decline in price, the FTSE 100 has found support at its previous swing low on the daily chart. It is currently trading around the previous day’s high and approaching a significant resistance zone. A successful breakout above this zone may trigger further upside potential.
Trade Suggestion
Based on the technical analysis, a trade suggestion can be made for the FTSE 100:
- Buy at 7550.9
- Take profit at 7583.8
- Stop-loss at 7521.4
This trade suggestion aims to capture potential upside movement in the FTSE 100 based on the analysis of support and resistance levels.
FAQs
What is the significance of the weekly chart analysis?
Analyzing the weekly chart provides a broader perspective on the FTSE 100’s long-term trend and can help traders identify major support and resistance levels.
Why is the RSI indicator important?
The RSI indicator is a widely used momentum oscillator that helps traders gauge the strength and direction of price movements. It provides insights into overbought and oversold conditions in the market.
How does the stochastic indicator differ from the RSI?
While the RSI focuses on the internal strength of the market, the stochastic indicator compares a particular closing price to a range of prices over a specified period. It helps identify potential turning points in the market.
What are the key support and resistance levels to watch?
The immediate support level on the weekly chart is at 7518.7, while the resistance level is at 7548.0. On the daily chart, the support level is identified at 7521.9, and the resistance level is at 7556.1.
How can traders benefit from the analysis?
By considering the technical analysis and trade suggestions provided, traders can make informed decisions and potentially capitalize on the expected price movements of the FTSE 100.