

FTSE 100 Technical Analysis: Weekly Chart
FTSE 100 Trading in Down Channel on Weekly Chart
In the weekly chart, the FTSE 100 is currently trading in a downward channel, indicating a bearish trend. This pattern suggests that the market sentiment is negative and the index is likely to continue its decline.

FTSE 100 Trading Below All SMA on Weekly Chart
The FTSE 100 is currently trading below all Simple Moving Averages (SMA) on the weekly chart. This indicates a weak market performance and adds to the bearish outlook for the index.
RSI in Selling Zone, Showing Bearishness
The Relative Strength Index (RSI), a popular momentum oscillator, is in the selling zone on the weekly chart. This indicates that the FTSE 100 is oversold and further emphasizes the bearish sentiment prevailing in the market.
Stochastic Suggesting Downtrend on Weekly Chart
The Stochastic indicator, another widely used technical tool, is suggesting a downtrend for the FTSE 100 on the weekly chart. This further confirms the bearish outlook and signals potential downside pressure on the index.
Immediate Support and Resistance Levels
The immediate support level for the FTSE 100 is at 7323.1, while the resistance level is at 7373.3. These levels serve as important reference points for traders and investors to monitor price movements and make informed decisions.
Bearish Engulfing Pattern and Important Support Level
Analyzing the weekly chart, we observe that the FTSE 100’s price experienced a reversal after an initial rise and has been trading downward since then. The index is currently displaying a bearish engulfing pattern, indicating a strong bearish sentiment in the market. Furthermore, it is trading at a crucial support level, and if this level is breached, we may witness further downside potential.
FTSE 100 Technical Analysis: Daily Chart
FTSE 100 Trading in Down Channel on Daily Chart
Turning our attention to the daily chart, we can see that the FTSE 100 is also trading within a down channel. This reinforces the bearish trend observed on the weekly chart and suggests a continuation of the downward movement.
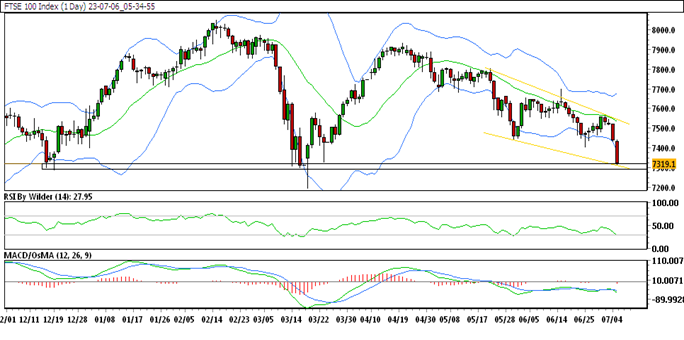
FTSE 100 Trading Below All SMA on Daily Chart
Similar to the weekly chart, the FTSE 100 remains below all Simple Moving Averages (SMA) on the daily chart. This implies a persistent weakness in the market and supports the bearish outlook for the index.
RSI in Selling Zone, Indicating Bearishness
On the daily chart, the Relative Strength Index (RSI) remains in the selling zone. This confirms the bearish sentiment prevailing in the market and suggests that the FTSE 100 is oversold.
Stochastic Indicating Downtrend on Daily Chart
The Stochastic oscillator on the daily chart is also signaling a downtrend for the FTSE 100. This aligns with the overall bearish outlook and indicates the potential for further downside movement.
Immediate Support and Resistance Levels
The immediate support level for the FTSE 100 on the daily chart is at 7320.1, while the resistance level is at 7372.1. These levels serve as important reference points for traders to assess potential price reversals and market reactions.
Sharp Decline and Important Support Level
Examining the daily chart, we can observe that the FTSE 100 has experienced a sharp decline and is setting new lows. It has also breached the prior day’s low, indicating continued selling pressure and strong bearish sentiment. The index is currently trading at a crucial support level, and if this level is broken, it could lead to additional declines in the market.
Trade Suggestion
Based on the technical analysis, a potential trade suggestion for the FTSE 100 is as follows:
- SELL at 7308.3
- Take Profit at 7240.6
- Stop Loss at 7379.02