

Following data borrowing, the FTSE drops even further ahead of the FOMC minutes.
FUNDAMENTAL OVERVIEW:
The FTSE 100 was down 0.6%, at 7,450.85.
According to data previously made public by the Office for National Statistics, public borrowing in the first seven months of the fiscal year was less than anticipated.
Excluding banks, public sector net borrowing between April and October was £98.3 billion, up £22 billion from the same time last year but over £17 billion below the Office for Budget Responsibility’s (OBR) March prediction.
With the exception of banks, public sector net borrowing in October was £14.9 billion, the second-highest amount since records for the month started in 1993. In addition, it exceeded both the OBR’s March estimate of £13.7 billion and consensus predictions.
Market observers were also monitoring the upcoming release of the latest FOMC minutes after the close, seeking insights into the Federal Reserve’s future actions.
Within the equity markets, IAG (LON: ICAG) experienced a decline as the owner of BA and Iberia outlined its medium-term objectives and expressed its dedication to resuming dividend payments once it ensures the security of its balance sheet and investment plans.
FTSE 100 TECHNICAL ANALYSIS DAILY CHART:
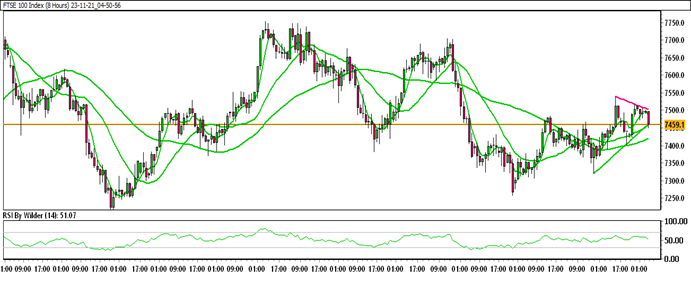
Technical Overview
FTSE 100 is currently trading within an up channel.
FTSE 100 is positioned below the 20&50 Moving Averages (SMA).
The Relative Strength Index (RSI) is in the buying zone, while the Stochastic oscillator suggests a negative trend.
Immediate Resistance level: 7510.2
Immediate support level: 7448.1
HOW TO TRADE FTSE 100
After an initial decline, the FTSE 100 found support and briefly reversed to the upside. However, this upward movement was short-lived, and the price eventually declined again. Currently, the FTSE 100 is constrained on the upside and is approaching a critical support zone. If this zone is breached, there is the potential for further downside.
TRADE SUGGESTION- STOP SELL– 7427.4, TAKE PROFIT AT- 7338.9, SL AT- 7483.9.