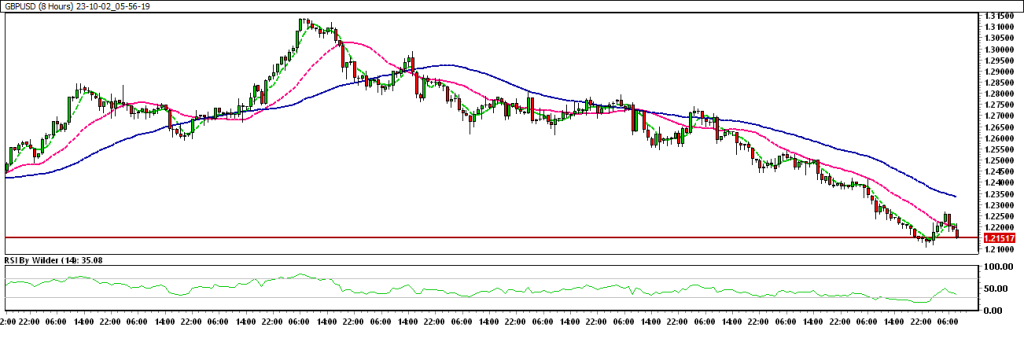
GBP/USD struggles below 1.2200, awaits central bank’s speakers.
FUNDAMENTAL OVERVIEW
GBP/USD spent the Asian session in a narrow range near 1.2200 before turning south and retreating to the 1.2150 region. The pair is affected by the gloomy market environment, which is mirrored in the falling US stock index futures, as markets wait for US PMI data and central banker comments.
Early in the morning in Europe, GBP/USD increased to 1.2220 before losing momentum and finishing negative for the day below 1.2200. Technical buyers may become interested after the pair stabilizes above 1.2200 and establishes that level as support.
The preceding week saw a decline in the GBP/USD exchange rate as the US Dollar (USD) benefited from higher US Treasury bond yields and a risk-averse market environment. Investors exhaled a sigh of relief as the US Congress passed a stopgap funding agreement to prevent a government shutdown over the weekend. US stock index futures gained momentum at the weekly beginning and were last seen increasing by 0.5% to 0.8%, highlighting the improved market sentiment.
The ISM will publish the September Manufacturing PMI survey later in the day. It is anticipated that the manufacturing sector’s activity will continue to shrink as the headline PMI registers at 47.7. The inflationary component, the Prices Paid Index, is anticipated to increase slightly to 48.6 from 48.4. The USD might strengthen in the initial reaction if this data gets above 50 and shows rising pricing pressure in the second. However, based just on this report, investors are unlikely to take significant holdings.
Jerome Powell, the chairman of the Federal Reserve (Fed), and several other Fed policymakers will also speak during the American session.
GBP/USD TECHNICAL ANALYSIS DAILY CHART:

Technical Overview
GBP/USD is currently trading within a down channel.
GBP/USD is positioned below all Moving Averages (SMA).
The Relative Strength Index (RSI) is in the selling zone, while the Stochastic oscillator suggests a negative trend.
Immediate Resistance level: 1.2259
Immediate support level: 1.2132
HOW TO TRADE GBP/USD
Following a price increase, GBP/USD started trading in a down channel and kept a lower structure. Currently, the price has broken through its previous day’s low and is trading at a support level; if this level breaks down, further decline is expected.
TRADE SUGGESTION- STOP SELL – 1.2099, TAKE PROFIT AT- 1.1970, SL AT- 1.2191.

