

Gold rally stalls as yields edge up, while stocks gain momentum.
As risk sentiment improved and bond yields recovered on Tuesday, gold prices began to decline after experiencing a significant increase in the previous session. Investors are now waiting for the U.S. inflation data that is expected later this week.
Following the rising Israeli-Palestinian conflict, the gold price (XAU/USD) had substantial increases of over 1% on Monday and settled above the mid-$1,800 level. The safe-haven precious metal, which often gains from political and economic unrest, also benefits from the current retracement decline in US Treasury bond yields, which is being driven by decreased expectations for further Federal Reserve (Fed) rate hikes. This propels the non-yielding yellow metal up for a third straight day on Tuesday, reaching more than a one-week high, along with muted US Dollar (USD) price action.
“Markets remain responsive to new escalation indicators and fresh events that take place over the next several days. However, it appears that things have calmed down for the time being, according to Craig Erlam, senior markets analyst at OANDA.
GOLD TECHNICAL ANALYSIS DAILY CHART:
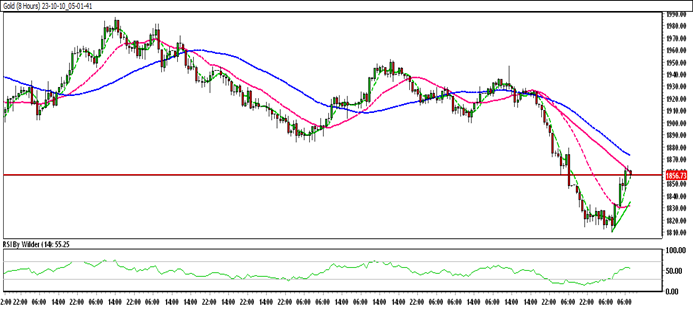
Technical Overview
Gold is currently trading within a down channel.
Gold is positioned above the 5&20 Moving Averages (SMA).
The Relative Strength Index (RSI) is in the buying zone, while the Stochastic oscillator suggests a positive trend.
Immediate Resistance level: 1864.52
Immediate support level: 1853.92
HOW TO TRADE GOLD
After a brief rise, the price of gold began to fall and followed a pattern of lower lows. Currently, the gold price is trading in a downward channel near the support level; if this support is broken, further decline is to be expected.
TRADE SUGGESTION- STOP SELL – 1843.81, TAKE PROFIT AT- 1820.20, SL AT- 1860.66.