

Gold falls below $1,970 as US yields rebound.
The price of gold fell below $1,970 on Tuesday as the 10-year US Treasury bond yield initially dropped over 1% but then turned positive, reaching 4.84% in the latest update. This yield movement influenced XAU/USD.
The US Dollar Index (DXY) continued its four-day losing streak at around 105.50. A decline in US bond yields could keep the US Dollar weaker, potentially supporting gold prices to reach the $2,000 mark.
While geopolitical tensions between Israel and Hamas often boost gold’s appeal as a safe-haven asset, current efforts to ease tensions and a risk-on sentiment may pose challenges. There are discussions within Israel regarding the potential scope of a ground invasion of Gaza.
Additionally, the week ahead is data-packed, with a focus on the US S&P Global PMI on Tuesday, Q3 Gross Domestic Product (GDP) figures on Thursday, and the Core Personal Consumption Expenditures (PCE) on Friday.
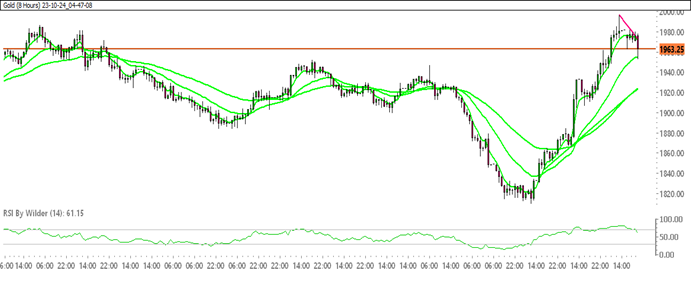
GOLD TECHNICAL ANALYSIS DAILY CHART:
Technical Overview
Gold is currently trading within an up channel.
Gold is positioned above the 20&50 Moving Average (SMA).
The Relative Strength Index (RSI) is in the buying zone, while the Stochastic oscillator suggests a negative trend.
Immediate Resistance level: 1978.70
Immediate support level: 1949.41
HOW TO TRADE GOLD
After a significant upward surge, the price of gold underwent a corrective phase but has since initiated another upward movement with renewed momentum. Currently, gold is trading in the vicinity of a crucial support zone. Should this support level hold, it could signal further upside potential.
TRADE SUGGESTION- BUY LIMIT – 1950.90, TAKE PROFIT AT- 1996.40, SL AT- 1923.27.