

Gold prices decline as the US Dollar rebounds, aligning with bearish technical indicators
FUNDAMENTAL OVERVIEW:
- Gold is following a bearish short-term technical trend alongside a rebound in the US Dollar.
- Diminished global inflation prospects are leading investors to shift towards bonds, potentially diverting investment from Gold.
- Technical indicators for XAU/USD suggest further downside risks following a recent trendline breach.
On Tuesday, Gold (XAU/USD) is trading down by over three-quarters of a percent, hovering in the $2,330s. A minor uptick in the US Dollar (USD), which typically moves inversely to Gold, might contribute to this decline, alongside potential asset reallocation into bonds. Overall, commodity markets are seeing a downturn, aligning with the short-term bearish technical observed for Gold.
Gold is losing strength amidst a broader sell-off in commodity markets. On Tuesday, the majority of commodities and many equity markets are experiencing declines, driven by concerns over global economic growth. This sentiment is likely influenced by various factors, including the recent OPEC+ decision and Indian elections. Additionally, the release of disappointing US ISM Manufacturing PMI data on Monday may have contributed to these market movements. Another factor at play could be investors reallocating to bonds as part of asset rotation strategies.
The Fed is poised to maintain steady rates at next week’s meeting. However, prior to that, significant labor market data is expected this week, which will likely influence the central bank’s rate considerations.
Additionally, rate decisions from the European Central Bank and the Bank of Canada are imminent this week, with both institutions anticipated to initiate interest rate cuts.
These lower rates are anticipated to be advantageous for gold and other precious metals, as the opportunity cost of investing in this sector typically rises in a high-interest-rate environment.
GOLD TECHNICAL ANALYSIS DAILY CHART:
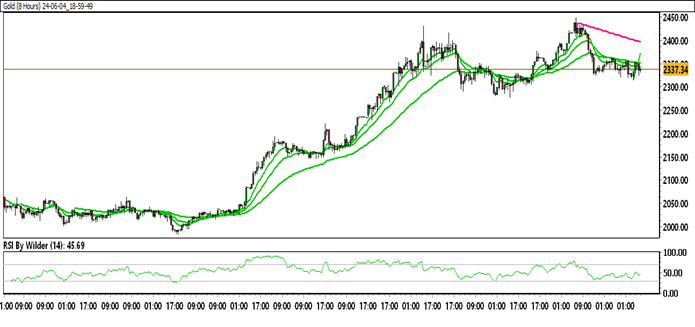
Technical Overview:
Gold is currently trading within a down channel.
Gold is positioned below all the Moving Averages (SMA).
The Relative Strength Index (RSI) is in the Neutral zone, while the Stochastic oscillator suggests a Neutral trend.
Immediate Resistance level: 2350.83
Immediate support level: 2324.85
HOW TO TRADE GOLD
Following an initial uptrend, gold faced resistance and developed a bearish engulfing pattern, resulting in a downturn and subsequent movement within a downward channel. Subsequently, the price consolidated within a range. Currently, gold is making an effort to ascend towards resistance levels, but a rejection could signal further downside potential.
TRADE SUGGESTION- SELL LIMIT – 2345.00, TAKE PROFIT AT- 2322.61, SL AT- 2358.09.