

Gold increases from a multi-month low and returns to above $1,960.
FUNDAMENTAL OVERVIEW
The gold price continues to rise on Friday after making a little overnight rebound from a low of $1,925–$1,924, or about three months ago and draws some follow-through purchasing for the second straight day.
The non-yielding gold price is considered as having some support due to the uncertainty surrounding the Federal Reserve’s (Fed) rate-hike trajectory, while any significant price appreciation remains difficult. The Fed’s ability to continue raising rates was questioned by Thursday’s very poor macroeconomic data from the United States (US), which further fed rumors that the cycle of policy tightening is about to come to an end.
However, the Fed has indicated that by the end of this year, borrowing costs may still need to climb by as much as 50 basis points. The US Dollar (USD) is helped by this and a slight increase in US Treasury bond yields to launch a minor comeback from a more than the one-month low reached earlier this Friday. Traders may be discouraged from placing optimistic bets around the US Dollar-denominated gold price by a small USD strength.
In addition, the Bank of England (BoE) is anticipated to increase interest rates by 25 basis points on June 22 in order to curb persistently high inflation. Aside from this, it is recommended to hold off on declaring that the Gold price has established a near-term bottom and positioning for any future gains until strong follow-through purchasing occurs in the equities markets.
GOLD TECHNICAL ANALYSIS DAILY CHART:
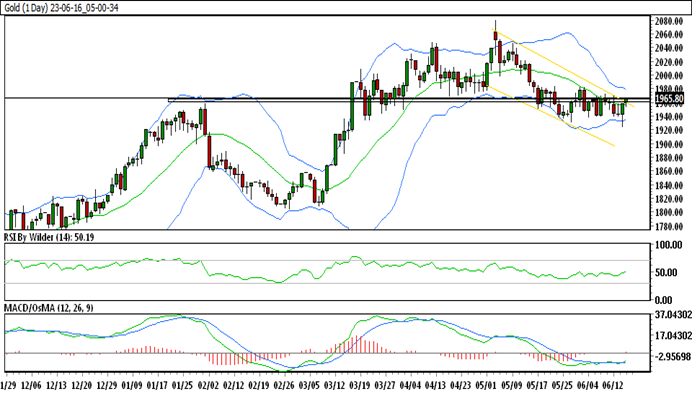
Technical Overview
Gold is trading in the down channel.
Gold currently trading above 5&20 SMA.
RSI is in buying zone which suggests bullishness and Stochastic is suggesting up trend.
Gold resistance is at 1966.42 & its immediate support level is 1959.85
HOW TO TRADE GOLD
After falling, the price of gold started to trade in a range. Currently, a hammer has formed and the price is trading at a key resistance level; if this level is broken, an additional upside is expected.