

Gold continues to rise from a two-month low and crosses $1,950
FUNDAMENTAL OVERVIEW
The price of gold picks up some buyers at the 100-day Simple Moving Average (SMA) and makes a slight comeback from the $1,937–$1,936 range, or more than a two-month low recorded the day before. Early in the European session, the XAU/USD rises back above the $1,950 mark, appearing to have ended a two-day losing skid.
Modest benefits from a weaker US dollar gold price
Following the recent run-up to more than a two-month high, the US Dollar (USD) bulls decide to take some profits off the table, which is considered as a major factor favouring the gold price. However, any significant upside still seems difficult, at least for the time being, due to views that the Federal Reserve (Fed) will maintain higher interest rates for a longer period of time to combat sticky inflation, which might support the US dollar. In fact, the markets have already begun to account for the probability of an additional 25 basis points (bps) at the June FOMC policy meeting.
The US PCE Price Index is still the centre of attention.
Hawkish Fed forecasts, on the other hand, drive up the yield on the rate-sensitive two-year US government bond to a two-and-a-half-month high and support chances that some US dip-buying may start to materialise. This could prevent traders from making extreme bullish wagers on the non-yielding gold price before the US Personal Consumption Expenditures (PCE) Price Index report, which is scheduled to be released later during the North American session. The favoured inflation gauge of the Fed will affect the USD and expectations for future rate hikes, giving the XAU/USD some momentum.
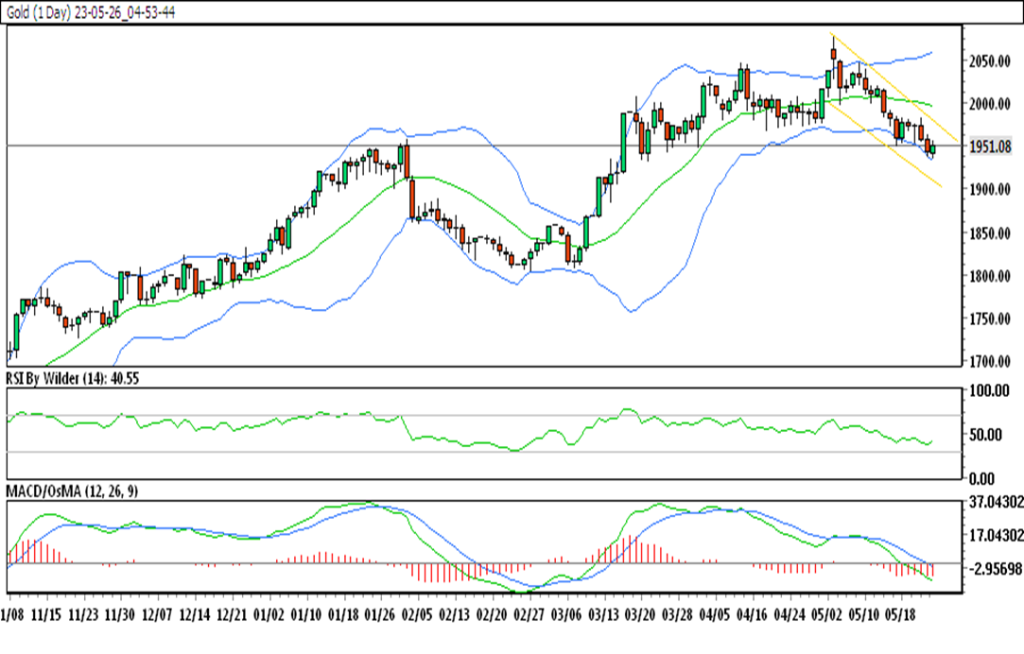
GOLD TECHNICAL ANALYSIS DAILY CHART:
Technical Overview
- Gold is trading in the down channel.
- Gold is currently trading below all SMA.
- RSI is in buying zone which suggests bullishness and Stochastic is suggesting a downtrend.
- Gold resistance is at 1950.54 & its immediate support level is 1932.90
HOW TO TRADE GOLD
After making a strong advance, gold reversed position and began trading in a downward channel. Price is currently attempting to move upward while trading near a significant resistance zone; if this zone is broken, the price will likely move upward till a second resistance.