

The price of gold is on an upward trajectory and appears set to achieve its most substantial monthly gains since November.
On Tuesday, the dip in gold prices to the $1,990 range drew the attention of buyers looking to capitalize on the lower prices. However, the prospect of a more hawkish stance from the Federal Reserve increased US bond yields, and a relatively mild strengthening of the US dollar might limit potential gains.
The price of gold (XAU/USD) has rebounded from a brief dip to $1,990 and reached a new daily high in the early European session. Nevertheless, it has not yet crossed the psychological threshold of $2,000, primarily due to the anticipation that the Federal Reserve (Fed) will consider one more interest rate hike in 2023 to maintain inflation at its 2% target. This hawkish stance is bolstering US Treasury bond yields, thereby revitalizing demand for the US Dollar (USD) and potentially restraining the gains of gold, which does not yield interest.
Furthermore, Israel’s more measured approach to its entry into Gaza has alleviated concerns of a broader crisis in the Middle East and has weakened the appeal of the safe-haven gold price. Nonetheless, there remains a potential for the Israel-Hamas conflict to escalate further, and coupled with uncertainties surrounding China’s economic recovery, this supports XAU/USD’s attractiveness to dip-buyers around the $1,990 range. The presence of these dip-buyers suggests a need for caution when considering any significant corrective decline in the market.
Traders may choose to stay cautious and avoid making major moves as they approach a two-day FOMC monetary policy meeting that kicks off this Tuesday.
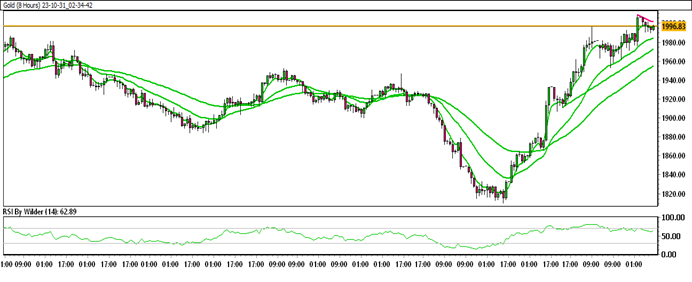
GOLD TECHNICAL ANALYSIS DAILY CHART:
Technical Overview
Gold is currently trading within an up channel.
Gold is positioned above all Moving Averages (SMA).
The Relative Strength Index (RSI) is in the buying zone, while the Stochastic oscillator suggests a positive trend.
Immediate Resistance level: 2005.77
Immediate support level: 1989.29
HOW TO TRADE GOLD
After an initial rise in gold prices, they encountered a resistance point and subsequently declined, trading downward until they found support. From this support level, gold began to rise once more. At present, the price is hovering around a significant resistance zone, and if this zone is breached, further upward movement may be likely.
TRADE SUGGESTION- BUY LIMIT – 1983.69, TAKE PROFIT AT- 2021.81, SL AT- 1958.90.