

Gold price trades back and forth as investors await US inflation data.
- The gold price fluctuates as attention turns to U.S. inflation data.
- A consistently high inflation report might lead to increased expectations of a hawkish stance from the Federal Reserve.
- Several Federal Reserve policymakers are slated to deliver speeches today.
The gold price (XAU/USD) faces challenges in extending its rebound, with investors displaying caution in anticipation of the October US inflation data set to be released at 13:30 GMT. The precious metal consolidates, with investors likely holding off on forming new positions until after the release, seeking clearer insights into the monetary policy outlook provided by the inflation data.
Economists anticipate a consistent growth rate in the core Consumer Price Index (CPI), with the expectation of a reduction in headline inflation. A sustained report on U.S. inflation could lead to expectations of additional policy tightening by the Federal Reserve (Fed). The Fed is dedicated to promptly achieving a 2% inflation target and is prepared to raise rates if it perceives inflation becoming entrenched.
The gold price bounces back, reaching nearly $1,945.00, but faces challenges in extending gains as investors exercise caution before the release of October’s US inflation data. The precious metal trades within a narrow range, with investors anticipated to take positions after the release of consumer inflation figures. These figures will provide insights into the potential interest rate actions by the Federal Reserve at its December monetary policy meeting, depending on the degree of persistence in US inflation.
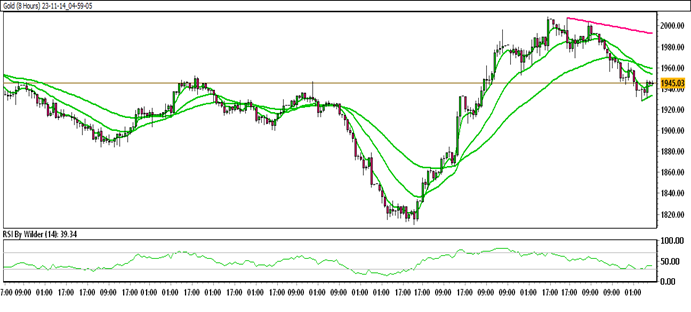
GOLD TECHNICAL ANALYSIS DAILY CHART:
Technical Overview
Gold is currently trading within a down channel.
Gold is positioned below the 20&50 Moving Average (SMA).
The Relative Strength Index (RSI) is in the selling zone, while the Stochastic oscillator suggests a neutral trend.
Immediate Resistance level: 1952.21
Immediate support level: 1933.68
HOW TO TRADE GOLD
Following a significant upward movement, the gold price encountered resistance and subsequently declined. This led to the formation of a double-top pattern, triggering a sharp fall in the price. Currently, the price is hovering around a crucial support zone, and if this level is breached, further declines can be anticipated.
TRADE SUGGESTION- STOP SELL – 1927.50, TAKE PROFIT AT- 1898.66, SL AT- 1947.41.