

Gold’s price has been fluctuating at around $1,950.
Fundamental Overview
Understanding the Volatility of Gold Prices
The price of gold has experienced fluctuations, currently hovering around $1,950. These shifts are influenced by various factors, including economic data releases and changes in the benchmark 10-year US Treasury bond yield. Recently, the yield has decreased by over 1%, contributing to the stability of XAU/USD (gold price).
Positive Market Sentiment Boosts Gold’s Value
During the London session, gold witnessed substantial purchasing demand, particularly at $1,947.50. Market optimism stems from the expectation that the Federal Reserve (Fed) will raise interest rates only once more this year. Consequently, gold surpassed the critical barrier level of $1,950.00.
Decreased Risk Appetite Impacts Market Dynamics
As investors in the United States enjoy an extended weekend due to Juneteenth, the decline of S&P500 futures indicates a reduction in risk-taking capacity. Consequently, assets with a high perceived risk have experienced diminished appeal.
Anticipating Consolidation and Monetary Policy Changes
With increasing valuations and the likelihood of continued tightening by the Fed, HSBC economists advise investors to prepare for upcoming consolidation. However, it is worth noting that the Fed’s monetary policy tightening cycle is nearing its conclusion, potentially benefiting US stocks.
Key Factors to Monitor
Traders will closely monitor the comments made by Fed policymakers during Chairman Powell’s two-day appearance. Notably, a “live” gathering is scheduled for July, and market expectations indicate a possibility of a 25-basis point rate increase of over 70%. Any deviation from this projection could impact the price of gold positively. Conversely, a confirmed interest rate hike for the following month would likely support the USD.
Gold Technical Analysis: Daily Chart
Understanding Gold’s Technical Trends
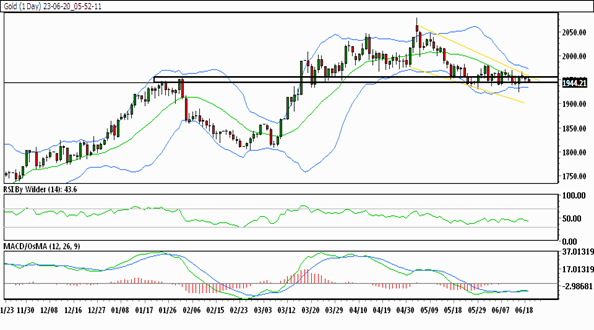
Analyzing Gold’s daily chart reveals the following insights:
- Downward Trading Channel: Gold is currently trading within a downward channel.
- SMA Positioning: Gold’s price is below all Simple Moving Averages (SMA).
- RSI and Stochastic Indicators: RSI suggests bullishness, while Stochastic indicates no clear trend.
- Support and Resistance Levels: Gold faces resistance at 1956.05, while immediate support lies at 1944.69.
How to Trade Gold
Navigating Gold’s Price Fluctuations
Following a period of price appreciation, gold entered a phase of constant fluctuation. Presently, gold’s price is declining and has surpassed the previous day’s low. It currently rests on a crucial support level, and if this level is breached, further declines are anticipated.
Trade Suggestion:
To take advantage of the current market conditions, consider the following trade suggestion:
- Sell at 1941.78
- Take Profit at 1923.67
- Stop Loss at 1955.78
By staying informed about the latest trends in gold trading, you can make well-informed investment decisions and potentially maximize your returns.