

EURCHF Technical Analysis: Weekly Chart
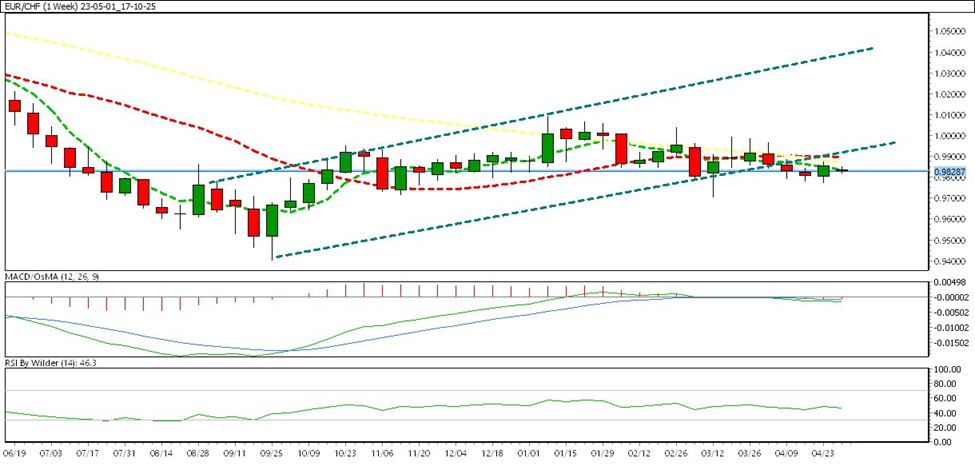
In the weekly charts, EURCHF was trading in an up channel. EURCHF is currently trading below all SMA except MA (5).
RSI is in the selling zone which indicates bearishness. MACD is currently below zero which indicates bearishness.
Its immediate support is 0.98000 the resistance level is at 0.99000
EURCHF was traded in a down channel before there is a downside breakout.
EURCHF Technical Analysis: Daily Chart
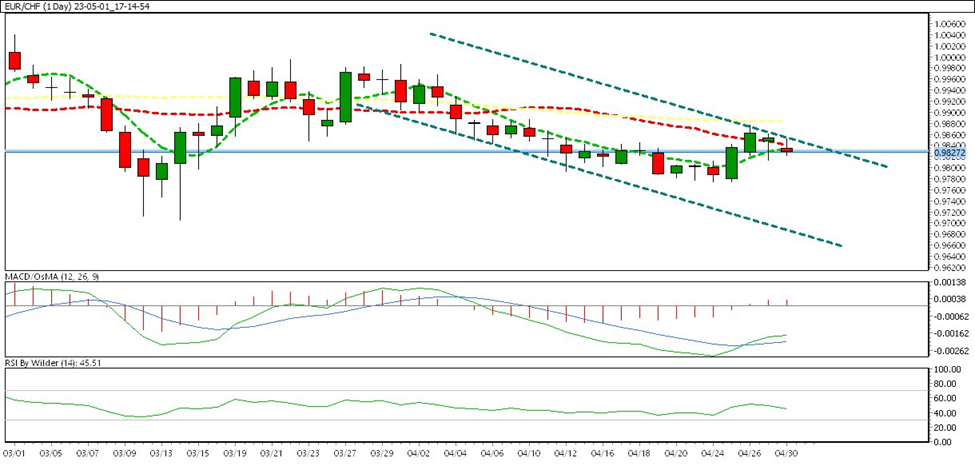
In the daily charts, EURCHF is trading in a down channel. EURCHF is currently trading below all SMA except MA (5)
RSI is in the neutral zone which indicates neutralness. MACD is currently below zero which indicates bearishness.
Its immediate support is 0.98000 the resistance level is at 0.99000
EURCHF will trade in a down channel until there is a trend reversal.
How to Trade EURCHF this Week:
EURCHF will follow the downtrend until its trend reversal. So, remain bearish on EURCHF.