

DISNEY TECHNICAL ANALYSIS: WEEKLY CHART
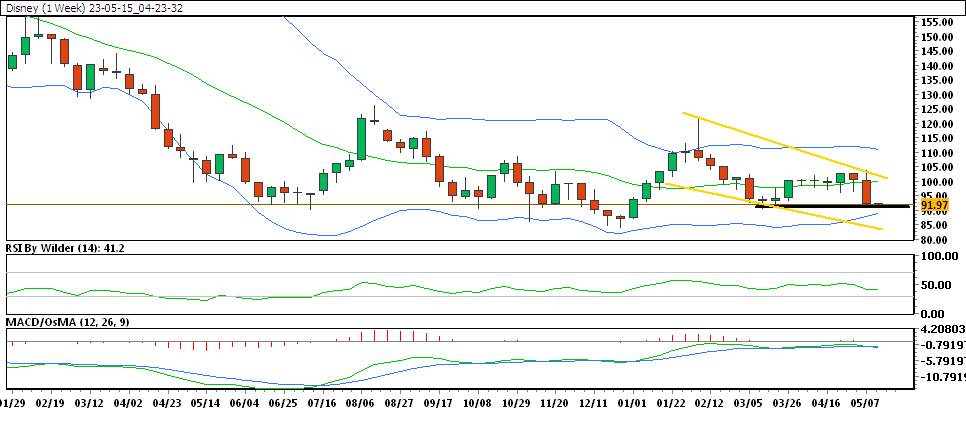
In the weekly chart, Disney is trading in down channel.
Disney is currently trading below all SMA.
RSI is in selling zone, which shows bearishness. Stochastic is suggesting down trend.
Its immediate support is at 91.91 & the resistance is at 94.14
The price of Disney stock is falling and developing lower low structures. Currently, the price has broken the previous week’s low and is trading at a key support level; if this level is broken, Disney’s price would drop much more.
DISNEY TECHNICAL ANALYSIS: DAILY CHART
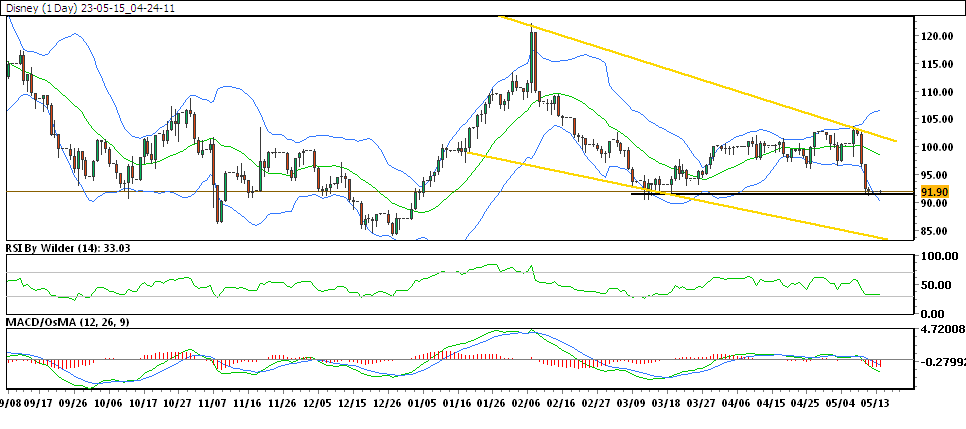
In the daily chart, Disney is trading in down channel.
Disney is currently trading below all SMA.
RSI is in selling zone, which shows bullishness. Stochastic is suggesting no trend.
Its immediate support is at 91.89 & the resistance is at 94.21
The price of Disney stock is falling and developing lower low structures. Currently, the price has broken the previous day low and is trading at a key support level; if this level is broken, Disney’s price would drop much more.