

Nasdaq 100 Index Technical Analysis: Weekly Chart
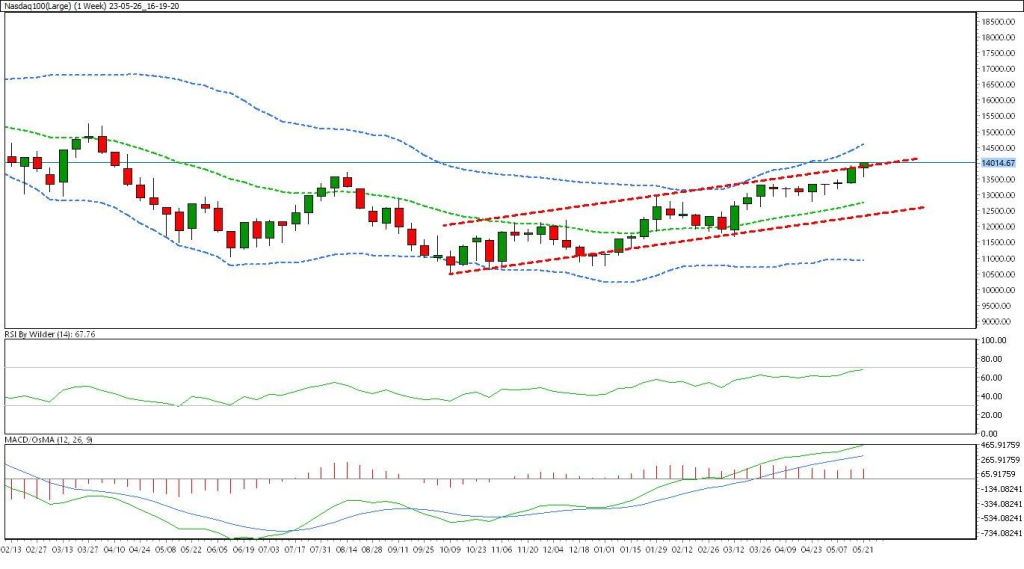
In the weekly charts, Nasdaq 100 is trading in an up channel. Nasdaq 100 is currently trading above all SMA.
RSI is in the buying zone which indicates bullishness. MACD is currently above zero which indicates bullishness.
Its immediate support is 13000.00 the resistance level is at 14500.00
Nasdaq 100 will trade in an up channel until there is a trend reversal.
Nasdaq 100 Index Technical Analysis: Daily Chart
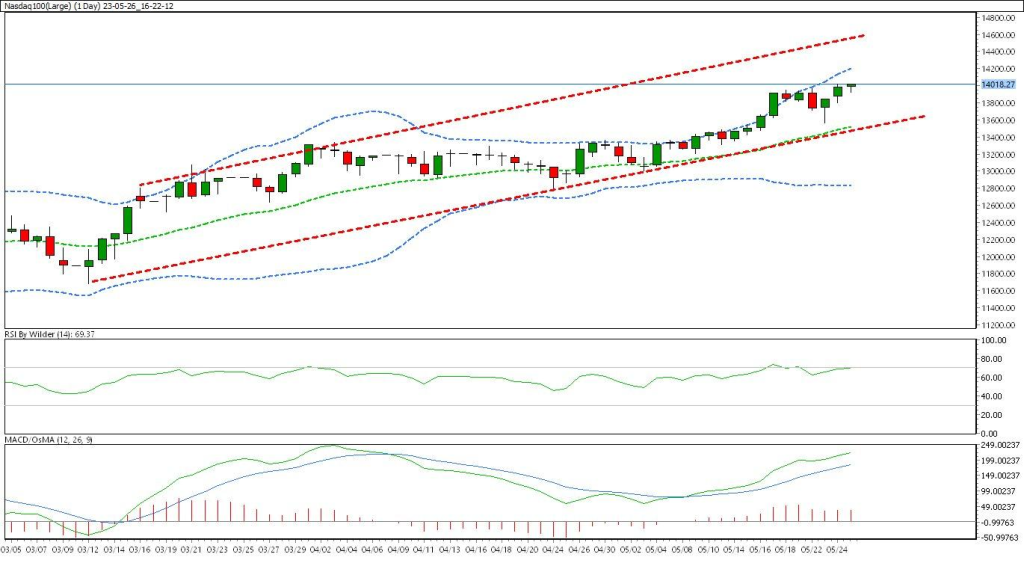
In the daily charts, Nasdaq 100 is trading in an up channel. Nasdaq 100 is currently trading above all SMA.
RSI is in the buying zone which indicates bullishness. MACD is currently above zero which indicates bullishness.
Its immediate support is 13000.00 the resistance level is at 14800.00
Nasdaq 100 will trade in an up channel until there is a trend reversal.
How to Trade Nasdaq 100 Index this Week:
Nasdaq 100 will follow the uptrend until its trend reversal. So, remain bullish on Nasdaq 100.