
Natural gas ends its rally with a loss of over 1.5% ahead of the US session
FUNDAMENTAL OVERVIEW:
- Natural gas fell over 1.5% on Thursday, following an impressive 8% gain earlier in the week.
- Profit-taking occurred after reports of Ukrainian forces entering Russia.
- Meanwhile, the US Dollar Index eased after a two-day recovery.
Natural gas prices (XNG/USD) eased on Thursday after a sharp surge of over 8% earlier in the week, driven by reports of Ukrainian forces crossing into Russia and targeting installations in the Kursk region. The potential for Russia to further restrict or cut off gas supplies to Europe had already been factored in by Tuesday.
At the same time, the US Dollar Index (DXY) is also retreating, as dollar bulls failed to push it above a key resistance level. This technical setback could lead to further declines in the US Dollar (USD). The weekly US Jobless Claims data release on Thursday is expected to be a major economic event, potentially increasing market volatility.
Natural gas prices may have experienced a strong two-day recovery, but this could have negative implications for prices in the long run.
NATURAL GAS TECHNICAL ANALYSIS DAILY CHART:
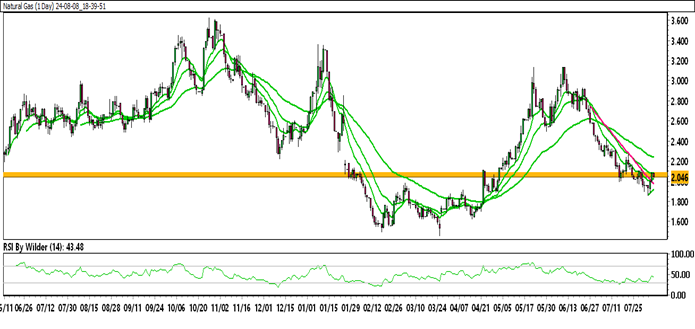
Technical Overview:
Natural Gas is currently trading within a down channel.
Natural Gas is positioned below all the Moving Averages (SMA).
The Relative Strength Index (RSI) is in a Neutral zone, while the Stochastic oscillator suggests a Negative trend.
Immediate Resistance level: 2.16
Immediate support level: 2.02
HOW TO TRADE NATURAL GAS
Natural Gas surged initially but reversed course after forming a double top and breaking key support. Prices have plummeted, establishing a new low and currently testing resistance. A failure to break this resistance could signal further downside.