
Natural Gas declines by over 1% as selling pressure persists
FUNDAMENTAL OVERVIEW:
- Natural Gas drops below $2.50, approaching a six-week low.
- A Louisiana judge has lifted Biden’s ban on new licenses for LNG exports.
- The US Dollar index surges above 106.00 on concerns regarding a potential Trump victory.
The price of Gas (XNG/USD) is bidding farewell to the $2.50 mark, continuing its six-day losing streak. It has already lost over 15% in value since June 25th, with potential for further declines following a ruling by a Louisiana judge on Monday to lift the ban on new export licenses for Liquified Natural Gas (LNG) imposed by the Biden administration earlier this year as part of climate reforms.
Simultaneously, the US Dollar Index (DXY), which gauges the Greenback’s strength against six major currencies, is gaining ground amid concerns in the bond markets. Recent polls showing former US President Donald Trump leading have raised worries about his fiscal policies impacting the bond market negatively. Increased spending could exacerbate US debt levels, with insufficient tariffs to counterbalance potential fiscal excesses.
At the time of writing, Natural Gas is priced at $2.42 per MMBtu.
NATURAL GAS TECHNICAL ANALYSIS DAILY CHART:
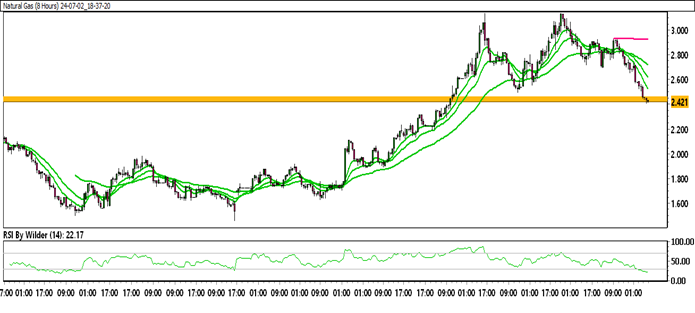
Technical Overview:
Natural Gas is currently trading within the down channel.
Natural Gas is positioned below all the Moving Averages (SMA).
The Relative Strength Index (RSI) is in the Selling zone, while the Stochastic oscillator suggests a Negative trend.
Immediate Resistance level: 2.49
Immediate support level: 2.39
HOW TO TRADE NATURAL GAS
Natural gas prices took a tumble after a brief surge. They initially rose sharply, but then met resistance and fell back down. This price movement formed a “double top” pattern, often seen as a bearish signal. Natural gas is trading below a key support level (neckline) and recently attempted to revisit the resistance level before dropping again.