

The NZD/USD pair remains subdued near the 0.6050 level, approaching two-month lows
FUNDAMENTAL OVERVIEW:
- The NZD/USD pair may approach immediate support near the two-month low of 0.6039.
- An analysis of the daily chart indicates a bearish sentiment in the short term for the pair.
- However, breaking above the immediate resistance levels at the nine-day and 50-day EMAs could lead to a shift towards a bullish outlook.
The NZD/USD pair is experiencing a pullback after two consecutive days of gains, trading around 0.6060 during European hours on Monday. Daily chart analysis indicates that the pair remains below the nine-day Exponential Moving Average (EMA), suggesting a bearish bias in the short term.
Additionally, Relative Strength Index (RSI) is consolidating below the 30 level, further supporting the prevailing bearish sentiment. The nine-day EMA also remains beneath the 50-day EMA, underscoring the weakness in the pair’s short-term price trend.
On Monday, the People’s Bank of China (PBoC) announced a reduction in the one-year Loan Prime Rate (LPR) by 25 basis points, lowering it from 3.35% to 3.10%. Additionally, the five-year LPR was cut from 3.85% to 3.60%. This latest effort to stimulate growth and combat deflation is expected to support the New Zealand Dollar (NZD), given China’s status as a significant trading partner for New Zealand.
However, growing expectations for more aggressive easing from the Reserve Bank of New Zealand (RBNZ)—following a decrease in inflation to within the central bank’s target range of 1% to 3% in the third quarter—could limit potential gains for the NZD.
Conversely, market expectations for a less aggressive easing policy from the Federal Reserve may strengthen the US Dollar against the Kiwi.
Read More – Daily Technical Analysis By Capital Street FX
NZD/USD TECHNICAL ANALYSIS DAILY CHART:
Technical Overview:
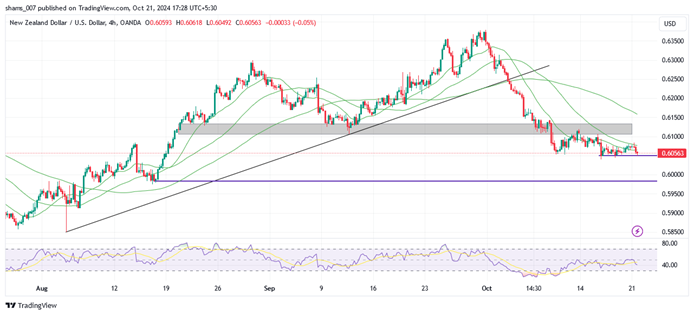
NZD/USD is currently trading within a down channel.
NZD/USD is positioned below all the Moving Averages (SMA).
The Relative Strength Index (RSI) is in the Selling zone, while the Stochastic oscillator suggests a Neutral trend.
Immediate Resistance level: 0.6105
Immediate support level: 0.6049
HOW TO TRADE NZD/USD
The NZD/USD pair, after experiencing a sharp increase, encountered resistance and reversed direction, leading to a significant decline. The pair has breached a key support zone and is trading below it. At this stage, NZD/USD is consolidating near-immediate support, and a breakdown of this level could result in further declines.