

NZD/USD is approaching the upper boundary of its descending channel, with the price testing levels above 0.5950.
As the NZD/USD currency pair edges near the top of its descending channel, it’s hitting a crucial resistance point around the 0.5950 mark. Traders are watching closely to see if this level holds or if the pair might turn lower in response to pressure from economic and technical factors.
Market Fundamentals: What’s Driving the NZD/USD?
The NZD/USD pair is challenging the upper boundary near 0.5980, aligned with the nine-day exponential moving average (EMA). This technical alignment shows some upward potential, but other indicators suggest a bearish sentiment is still in play. Specifically, the 14-day Relative Strength Index (RSI) is sitting below the 50 mark; if it approaches the 30 level, this would further confirm a bearish outlook, signaling a potential drop toward the channel’s lower boundary at around 0.5880.
If NZD/USD doesn’t break through this upper resistance, it could reinforce the ongoing downtrend, indicating further downside risks.
Read More – Daily Forex Analysis
Current Movements in the NZD/USD Pair
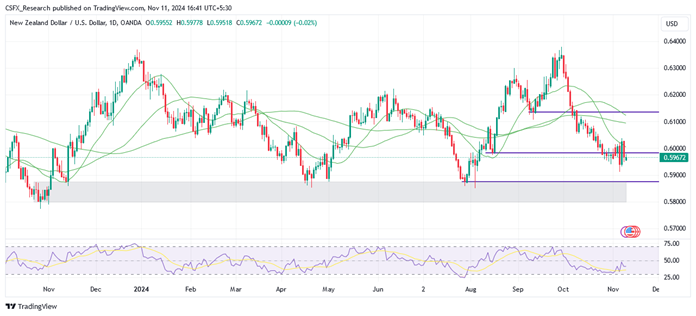
On Monday, NZD/USD stayed near 0.5960 for a second consecutive trading session, constrained within a descending channel on the daily chart. This channel indicates a bearish pattern, with the potential for continued declines if the trend persists. The pair bounced back to about 0.5965 during Asian trading hours, partly due to a slight increase in New Zealand’s inflation expectations. Yet, renewed strength in the US dollar, especially with political developments like Donald Trump’s potential influence on market sentiment, could maintain the downward pressure on NZD/USD. The upcoming US Consumer Price Index (CPI) release for October, set for Wednesday, is also expected to be a significant event for this pair’s direction.
In recent data from the Reserve Bank of New Zealand (RBNZ), two-year inflation expectations slightly increased to 2.12% in the fourth quarter, up from 2.03% in Q3. At the same time, one-year inflation expectations declined from 2.40% to 2.05%. While these numbers provide some support for the New Zealand Dollar, further strength in the US dollar could push NZD/USD lower.
If selling momentum continues, NZD/USD might test the key psychological support at 0.5900, followed by the lower end of its channel near 0.5880. A break below this channel boundary would deepen the bearish outlook, bringing the next support level around 0.5850 into focus.
NZD/USD Technical Analysis: Daily Chart Insights
Let’s take a closer look at the technical picture for NZD/USD based on daily chart indicators.
- Current Trend: NZD/USD trades within a defined descending channel, supporting a bearish outlook.
- Moving Averages: The pair is trading below its key Simple Moving Averages (SMAs), reinforcing downward momentum.
- Relative Strength Index (RSI): The RSI remains in the selling zone, suggesting continued bearish pressure, while the Stochastic Oscillator shows a more neutral stance, hinting that selling momentum may level out temporarily.
- Immediate Resistance: 0.5995
- Immediate Support: 0.5931
Trading Approach for NZD/USD: Bearish Sentiment with Potential Downside
After a strong rally, NZD/USD could not hold above a significant resistance level, leading to a reversal below key support. This has confirmed a bearish trend shift, and the pair is now consolidating near a resistance level. If it fails to break above this level, more downside is likely.
Trade Suggestion
- Position: Limit Sell at 0.5990
- Take Profit: 0.5874
- Stop Loss: 0.6082
Overall, the NZD/USD pair remains under pressure as technical and fundamental factors continue to weigh it down. With CPI data and US political events potentially influencing the market, traders should be prepared for heightened volatility in this pair’s performance.