

XAG/USD approaches the 14-day EMA around the $30.00 mark
FUNDAMENTAL OVERVIEW:
- Silver price encounters immediate resistance at the 14-day EMA around $29.83.
- The 14-day RSI remains near the 45 level, suggesting a neutral market outlook.
- The pair could test initial support at the four-month low of $28.74, reached on December 19.
Silver price (XAG/USD) recovers a portion of its recent losses from the previous session, trading near $29.70 per troy ounce during Tuesday’s European session. A daily chart review indicates neutral short-term price momentum, with the XAG/USD pair positioned near the nine-day and 14-day Exponential Moving Averages (EMAs). A breakout in either direction could indicate a clearer trend.
The 14-day Relative Strength Index (RSI) remains near the 45 level, indicating a neutral outlook. This suggests the market is balanced, with no clear signs of overbought or oversold conditions, reflecting an equilibrium between bullish and bearish forces.
Silver price is currently testing resistance at the 14-day EMA of $29.83, closely followed by the nine-day EMA at $29.84. A breakout above these levels could improve market sentiment and push the XAG/USD pair towards the key psychological level of $30.00. A sustained move above this level could strengthen bullish momentum, potentially targeting a two-month high of $32.28, last reached on December 9.
On the downside, initial support lies at the four-month low of $28.74, recorded on December 19, followed by the critical $28.00 psychological level. A drop below these levels could heighten bearish momentum, signaling further downside potential for silver.
Silver’s industrial demand remains a key driver of its price, supported by strong global needs in sectors such as solar energy and electronics. The production of solar panels, a major consumer of silver, continues to provide upward momentum, while geopolitical and inflationary risks have enhanced silver’s appeal as a hedge.
READ MORE – Understanding the History and Evolution of Bitcoin : Future Trends
SILVER TECHNICAL ANALYSIS DAILY CHART:
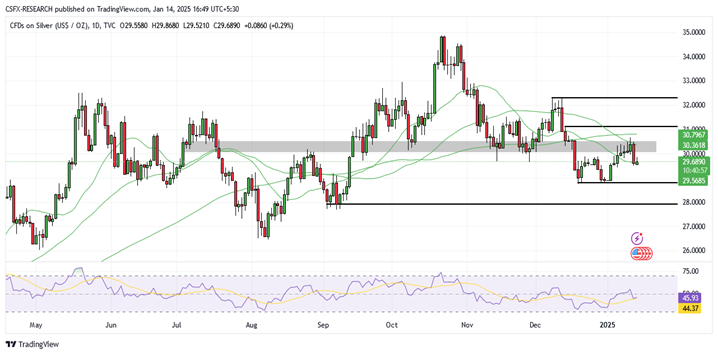
Technical Overview:
Silver is trading within a down channel.
Silver is moving below all the Moving Averages (SMA).
The Relative Strength Index (RSI) is in the Neutral Zone, while the Stochastic oscillator suggests a Neutral trend.
Immediate Resistance level: 30.48
Immediate support level: 29.47
Read more – WTI Crude Oil Dips And Natural Gas Retreats.
HOW TO TRADE SILVER
Silver saw a notable price surge, quickly followed by a sharp reversal. After falling below a crucial support level, it has been difficult to regain upward momentum. A recent attempt to rally was rejected at resistance, forming a bearish engulfing candle pattern. This indicates the possibility of continued downside movement.