
XAG/USD: Analyzing Silver’s Recent Price Movement.
In the ever-fluctuating world of finance, staying updated on the latest developments in the market is paramount. Today, we turn our attention to XAG/USD, where silver prices have experienced significant movements lately. In this article, we’ll delve into the fundamental and technical aspects of this precious metal’s performance, helping you make informed trading decisions.
FUNDAMENTAL OVERVIEW
Silver’s Recent Decline
Silver, often seen as a safe haven asset, found itself at a one-week low on Monday, marking its fourth consecutive day of decline. The precious metal has been under pressure recently, but it managed to maintain its position above the critical $24.00 round-figure level.
Technical Factors at Play
The recent decline in silver prices might be attributed to technical selling pressure. This followed a series of failed attempts to breach a descending trend line, which has been in place for over a year. This trend line’s resistance zone lies around the $26.10-$26.15 area.
Before taking any bearish positions on XAG/USD and anticipating further price drops, it’s essential to exercise caution. This caution is warranted due to mixed signals from oscillators on both hourly and daily charts.
XAG/USD TECHNICAL ANALYSIS – DAILY CHART
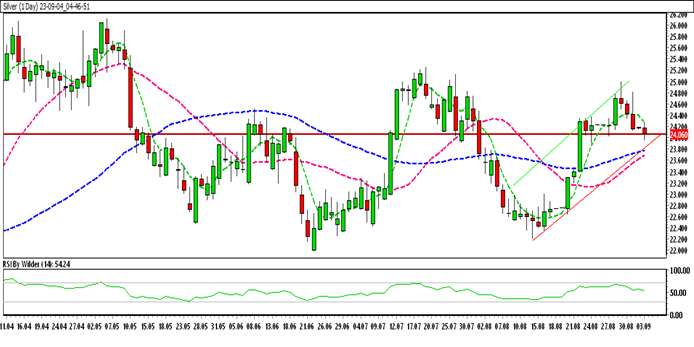
A Closer Look at the Technicals
Let’s dive into the technical analysis of XAG/USD’s daily chart:
- Trading Channel: Silver is currently trading within an upward channel, indicating a potential for bullish movements.
- Moving Averages: The precious metal is positioned above the 20-day and 50-day Moving Averages (SMA), a sign of strength.
- Relative Strength Index (RSI): The RSI is situated in the buying zone, suggesting that silver may have some bullish momentum left.
- Stochastic Oscillator: However, the Stochastic oscillator hints at a negative trend, adding a layer of complexity to the picture.
Key Levels to Watch
For traders looking to capitalize on these price movements, it’s crucial to keep an eye on the following levels:
- Immediate Resistance: $24.26
- Immediate Support: $23.89
HOW TO TRADE XAG/USD
Current Market Scenario
In recent times, silver’s price has experienced a period of consolidation, followed by a decline. However, it found support at a critical level and resumed an upward trajectory. As of now, silver is trading in a resistance area.
Trade Suggestion
Considering the technical and fundamental aspects, here’s a trade suggestion:
- Entry Point: $24.46
- Take Profit: $25.26
- Stop Loss: $23.87
This trade suggestion points towards a bullish bias for XAG/USD, with the potential for further upside if the resistance area is breached successfully.
In conclusion, the silver market is currently navigating through interesting times, with both fundamental and technical factors influencing its price. Traders should stay vigilant, monitor key levels, and consider the trade suggestion as a starting point for their analysis.