

SILVER: WEEKLY SCENARIO
SILVER Technical Analysis: Weekly Chart
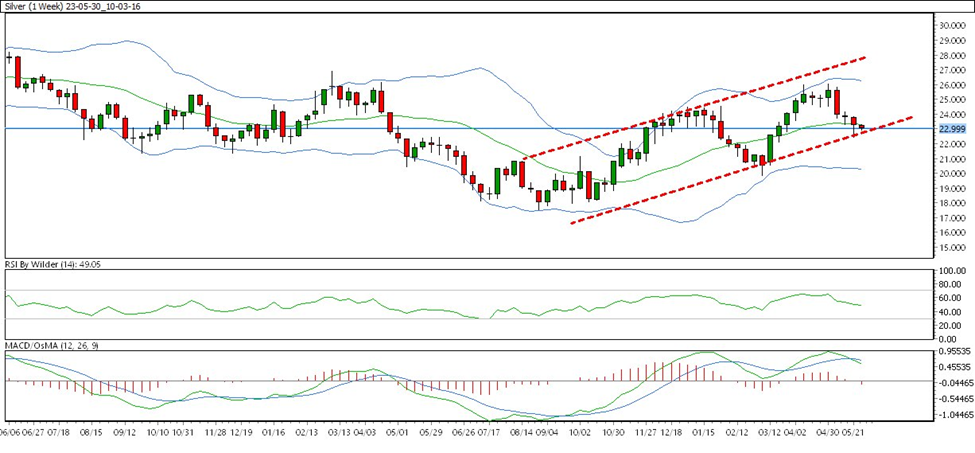
In the weekly charts, SILVER is trading in an up channel. SILVER is currently trading above all SMA except MA (5).
RSI is in the overbought zone which indicates mild -bearishness. MACD is currently above zero which indicates bullishness.
Its immediate support is 22.000 the resistance level is at 25.900
SILVER will trade in a down channel until there is a trend reversal.
SILVER Technical Analysis: Daily Chart
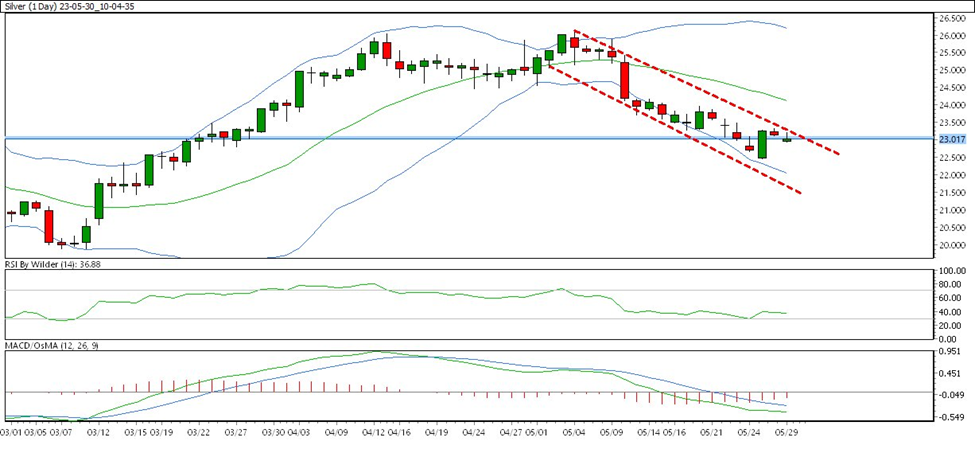
In the daily charts, SILVER is trading in a down channel. SILVER is currently trading below all SMA.
RSI is in the buying zone which indicates bullishness. MACD is currently below zero which indicates bearishness.
Its immediate support is 22.55 the resistance level is at 23.50
SILVER will trade in a down channel until there is a trend reversal.
How to Trade SILVER this Week:
SILVER will follow the downtrend until its trend reversal. So, remain bearish on SILVER.