

S&P 500 WEEKLY SCENARIO.
S&P 500 TECHNICAL ANALYSIS: WEEKLY CHART
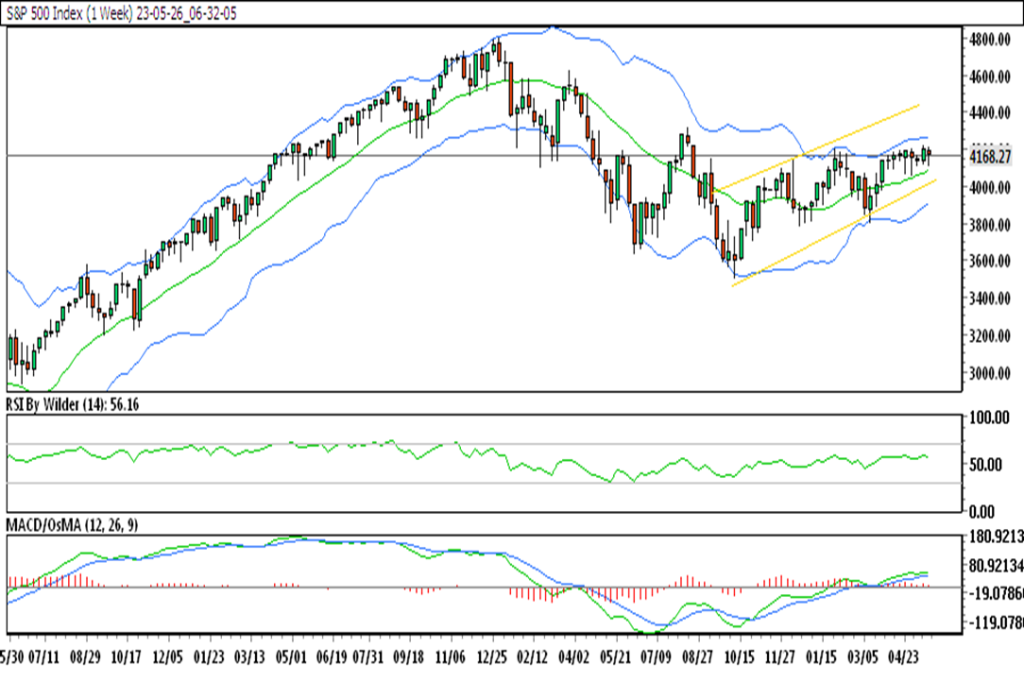
In the weekly chart, S&P 500 is trading in an up channel.
S&P 500 is currently trading above all SMA.
RSI is in buying zone, which shows bullishness. Stochastic is suggesting no trend.
Its immediate support is at 4162.27 & the resistance is at 4224.53
After making a strong advance, the S&P 500 had a small retracement and resumed hitting new highs; at the moment, it is trading at a crucial resistance level, and if it breaks through it, we may anticipate it to continue trading upward.
S&P 500 TECHNICAL ANALYSIS: DAILY CHART
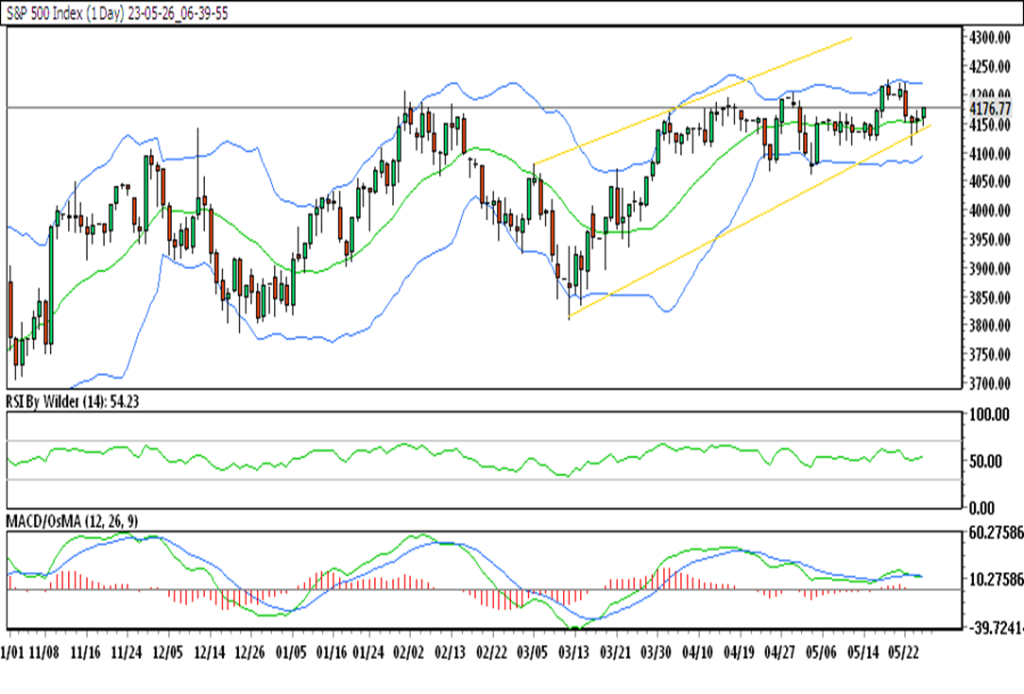
In the daily chart, S&P 500 is trading in an up channel.
S&P 500 is currently trading above all SMA.
RSI is in buying zone, which shows bullishness. Stochastic is suggesting a downtrend.
Its immediate support is at 4146.59 & the resistance is at 4184.11
On the daily chart, the S&P 500 is trading in an upward channel and is currently at an important resistance level; if this level is broken, further gain is anticipated.