
Hotter-Than-Expected Wholesale Inflation Report Triggers S&P 500 Futures Decline.
Introduction
In a surprising turn of events, S&P 500 futures experienced a decline following the release of a wholesale inflation report that surpassed expectations.

Wholesale Inflation Report Sparks Market Reaction
As the week drew to a close, investors were met with an unexpected twist as the latest inflation report revealed more heat than anticipated, leading to a drop in S&P 500 futures. The producer price index saw a notable increase of 0.3% from June to July, indicating potential challenges in the market landscape.
Economists Predicted Rise, but Reality Surpasses Expectations
Economists surveyed by Dow Jones had forecasted a modest 0.2% month-over-month increase in the producer price index. However, the actual rise of 0.3% signaled a stronger inflationary trend. This outcome raised concerns among both the Federal Reserve and market participants, who closely monitor such indicators.
Fed’s Caution in the Face of Inflation
Quincy Krosby, the chief global strategist at LPL Financial, emphasized the significance of the wholesale price surge. Krosby noted that this event serves as a stark reminder of the Federal Reserve’s data-dependent approach in managing inflation. Despite earlier expectations, the Fed remains cautious and hesitant to declare victory over inflation.
Additional Justification for the Hawkish Approach
The report’s unexpected intensity provided further support to the hawkish stance within the Federal Reserve. With inflation still a pressing concern, the hawkish wing gains validation in its pursuit of another rate increase. This move is aimed at curbing inflation before it escalates beyond control, highlighting the intricacies of the current economic landscape.
Consumer Price Index Reveals Mixed Signals
Interestingly, the consumer price index for July demonstrated a contrasting picture. The year-over-year basis indicated weaker growth, with prices climbing by 3.2%. This figure fell short of the average prediction of 3.3%. Digging deeper, the core CPI, which excludes variable costs like food and energy, saw a more substantial increase of 4.7% compared to the previous year.
S&P 500 Takes a Hit
In response to these developments, the S&P 500 experienced a notable decline of 0.5%. This downward movement highlights the immediate impact of the inflation report on the market.
Analyzing S&P 500 Technicals: A Closer Look
S&P 500 Technical Analysis Daily Chart
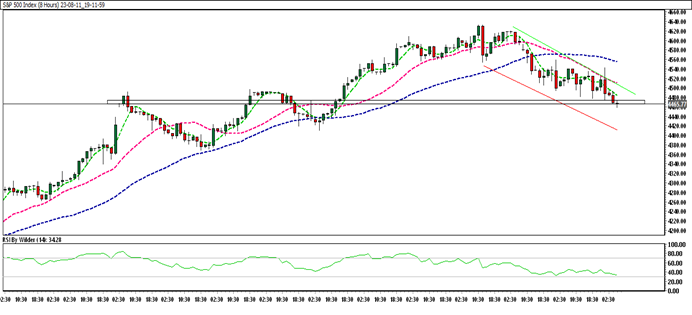
Taking a closer look at the technical aspects, the S&P 500 is currently trading within a down channel. Moreover, it finds itself trading below all Simple Moving Averages (SMA). These indicators hint at a bearish sentiment in the market.
RSI and Stochastic: A Bearish Picture
The Relative Strength Index (RSI) further supports the bearish outlook, as it positions itself in the selling zone. This suggests a prevailing negative trend. Adding to this sentiment, the Stochastic indicator also points towards a negative trend in the market.
Key Levels to Watch
For traders and investors, key levels come into play. The immediate resistance level stands at 4491.8, while the immediate support level is identified at 4461.5. These levels provide crucial insights into potential price movements.
Navigating S&P 500 Trading in the Current Week
Seizing Opportunities After the Downturn
Following a sudden surge in price, the S&P 500 shifted its trajectory and moved towards a downward trend. Notably, the index is currently hovering near a critical support zone. Should this zone be breached, it opens the door for further downward movement.
Trade Strategy: Seize the Momentum
As traders seek ways to capitalize on these market dynamics, a strategic approach is essential. A trade suggestion comes in the form of an entry at 4447.4, with a targeted price of 4414.1. To manage risk, a stop loss is advised at 4473.7.
Conclusion: Navigating Market Uncertainties
The market’s reaction to the wholesale inflation report highlights the delicate balance between economic data and market dynamics. While the unexpected rise created turbulence, it also offered valuable insights for traders and investors. The S&P 500’s response, coupled with technical indicators, forms a complex tapestry that requires strategic thinking and risk management in the face of uncertainties.
Frequently Asked Questions
Q1: What prompted the decline in S&P 500 futures?
The decline in S&P 500 futures was triggered by a higher-than-expected wholesale inflation report, which indicated a stronger inflationary trend than anticipated.
Q2: Why is the Federal Reserve cautious despite the inflation report?
The Federal Reserve remains cautious due to its data-dependent approach. It acknowledges that while the inflation report signals a surge, sustained economic conditions are essential before declaring victory over inflation.
Q3: How did the consumer price index perform in July?
In July, the consumer price index demonstrated mixed signals. Year-over-year growth was weaker than predicted, with prices rising by 3.2%, falling short of the average forecast of 3.3%.
Q4: What is the significance of the core CPI?
The core Consumer Price Index (CPI) excludes variable costs like food and energy. In the past year, it increased by 4.7%, indicating a more substantial rise compared to the overall CPI.