

Bitcoin continues to trade near $94,000, with overall market sentiment weighed down by concerns over U.S. trade tariffs and growing economic uncertainty. The broader cryptocurrency market remains subdued, showing limited movement across key assets like Bitcoin, Ethereum, XRP, and Dogecoin. Lingering risks and a lack of new catalysts have contributed to narrow trading ranges.
KEY HIGHLIGHTS
- Bitcoin Holds Near $94K Amid Trade Tensions, Market Caution
- Ripple Retreats Toward $2.00 As Bullish Momentum Weakens Further
- Ethereum Faces Selling Pressure After Rejection Below $1,880 Resistance
- Dogecoin Declines Below $0.1700 Following Failed Breakout Attempt
Bitcoin (BTC/USD)
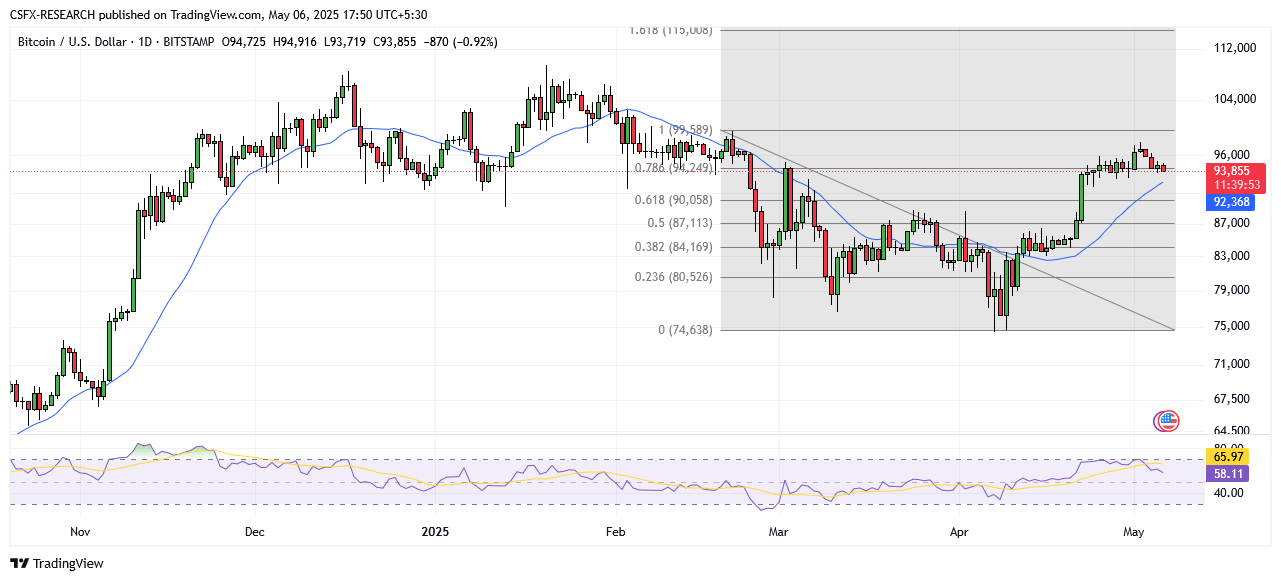
Price Action: Consolidation Near $94K Amid Tariff Concerns
Bitcoin traded lower on Tuesday, remaining within a narrow range due to heightened caution driven by rising U.S.-China trade tensions. The digital asset stayed within the $90,000 to $97,000 range, a band it has maintained for the past week, as bullish momentum from late April faded.
Key market drivers:
- U.S. tariff threats escalating trade war concerns
- Slowing global economic outlook
- Absence of fresh bullish triggers
Technical Overview

Moving Averages
Exponential Moving Averages:
- MA 10: 94,375.18 | Bearish crossover
- MA 20: 92,450.25 | Bullish crossover
- MA 50: 89,636.27 | Bullish crossover
Simple Moving Averages:
- MA 10: 94,981.29 | Bearish crossover
- MA 20: 92,384.96 | Bullish crossover
- MA 50: 87,112.56 | Bullish crossover
Indicators
- RSI: 58.22 | Buy Zone | Bullish
- Stochastic Oscillator: 59.26 | Buy Zone | Neutral
Resistance and Support Levels
- Resistance 1: 96,352.96
- Resistance 2: 101,420.45
- Support 1: 79,948.01
- Support 2: 74,880.52
Market Sentiment
- Overall Sentiment: Bullish
- Market Direction: Buy
Trade Suggestion
- Entry (Limit Buy): 90,157
- Take Profit: 99,445
- Stop Loss: 85,967
Ripple (XRP/USD)
Price Action: Bullish Breakout Delayed as Risks Persist
Ripple (XRP) is showing signs of a gradual decline, trading near $2.09. Despite a recent attempt at recovery, the price remains below key moving averages and a descending trendline from January.
Critical observations:
- Support at $2.00 remains vital for bullish continuation
- Resistance levels capped recent recovery efforts
- A breakout above key exponential MAs is required for renewed bullish momentum
Technical Overview

Moving Averages
Exponential Moving Averages:
- MA 10: 2.1664 | Bearish crossover
- MA 20: 2.1653 | Bearish crossover
- MA 50: 2.1959 | Bearish crossover
Simple Moving Averages:
- MA 10: 2.1976 | Bearish crossover
- MA 20: 2.1681 | Bearish crossover
- MA 50: 2.1742 | Bearish crossover
Indicators
- RSI: 43.08 | Neutral Zone | Neutral
- Stochastic Oscillator: 19.96 | Sell Zone | Neutral
Resistance and Support Levels
- Resistance 1: 2.3417
- Resistance 2: 2.5181
- Support 1: 1.7707
- Support 2: 1.5943
Market Sentiment
- Overall Sentiment: Bearish
- Market Direction: Sell
Trade Suggestion
- Entry (Limit Sell): 2.14
- Take Profit: 2.04
- Stop Loss: 2.22
Ethereum (ETH/USD)
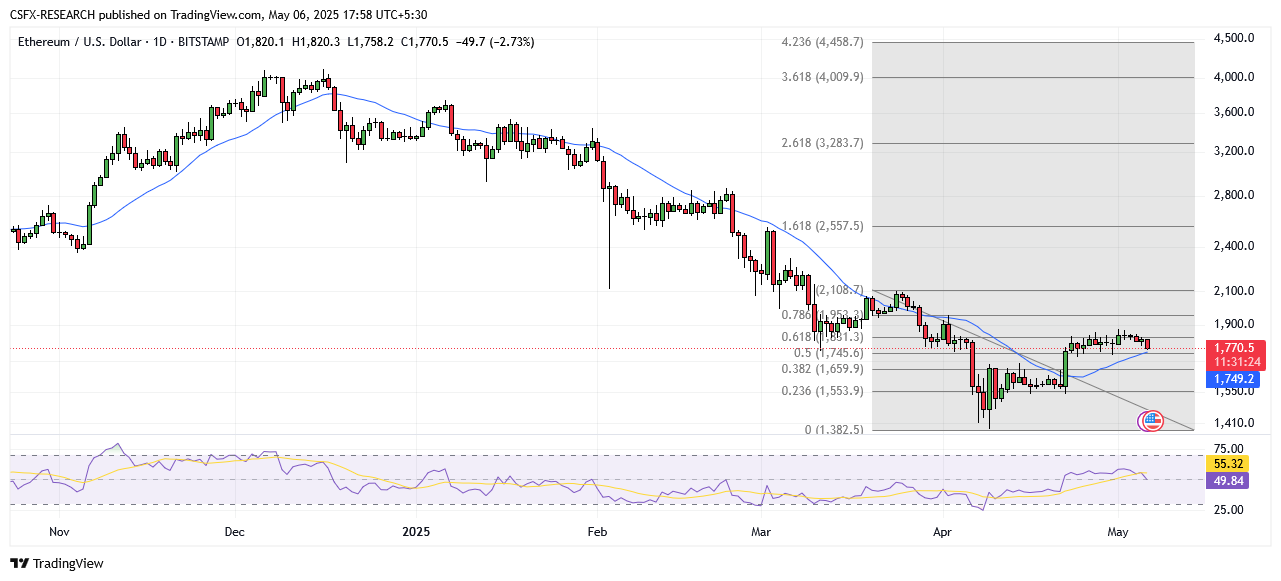
Price Action: Downside Risks Mount as Bears Regain Control
Ethereum is facing increasing downside pressure after failing to break above the $1,880 resistance level. The asset is now trading below $1,800 and the 100-hour SMA, with a risk of further declines.
Key takeaways:
- Resistance around $1,800 continues to limit gains
- Support near $1,750 is the key level to watch for further bearish pressure
- A move below $1,750 may trigger a deeper decline toward $1,720
Technical Overview
Moving Averages
Exponential Moving Averages:
- MA 10: 1,797.92 | Bearish crossover
- MA 20: 1,772.78 | Bullish crossover
- MA 50: 1,851.63 | Bearish crossover
Simple Moving Averages:
- MA 10: 1,810.65 | Bearish crossover
- MA 20: 1,749.38 | Bullish crossover
- MA 50: 1,779.36 | Bearish crossover
Indicators
- RSI: 50.14 | Buy Zone | Bullish
- Stochastic Oscillator: 66.19 | Buy Zone | Neutral
Resistance and Support Levels
- Resistance 1: 1,928.82
- Resistance 2: 2,063.15
- Support 1: 1,493.96
- Support 2: 1,359.63
Market Sentiment
- Overall Sentiment: Bearish
- Market Direction: Sell
Trade Suggestion
- Entry (Limit Sell): 1,793.6
- Take Profit: 1,675.4
- Stop Loss: 1,885.2
Dogecoin (DOGE/USD)
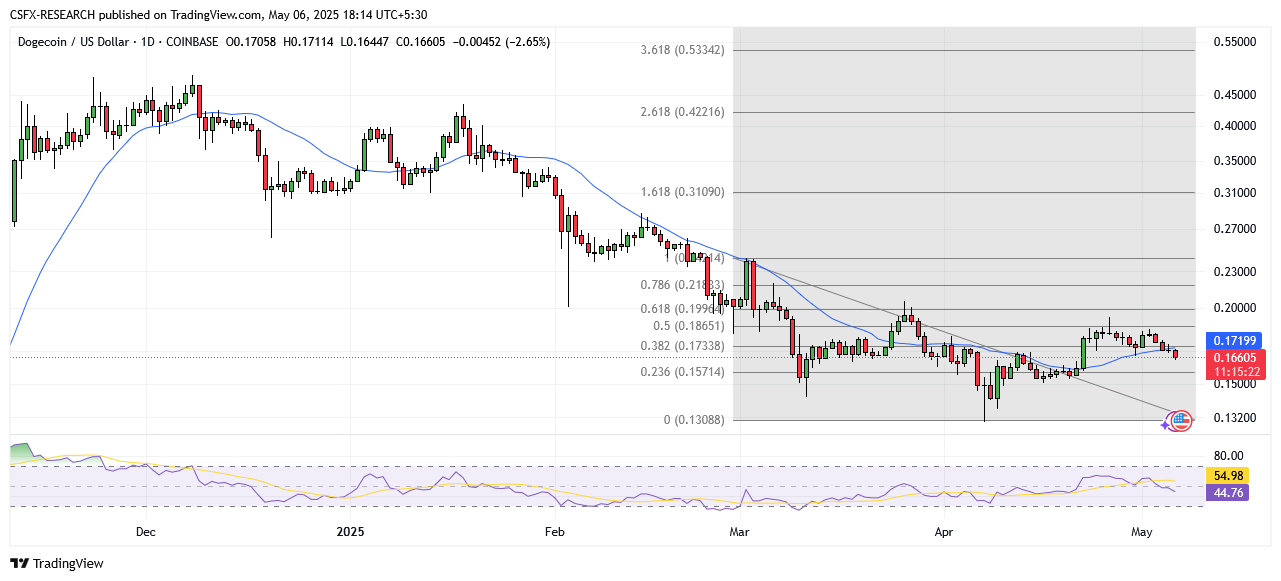
Price Action: Pullback Continues After Failing Resistance
Dogecoin has slipped from recent highs and is now trading below $0.1700, facing renewed bearish momentum. After failing to breach $0.1880, DOGE has tested the sub-$0.1680 zone.
Key developments:
- Price below $0.1700 and 100-hour SMA indicates downward momentum
- Rejection at $0.1700 could lead to another leg lower
- Support at $0.1408 is the next key level to monitor
Technical Overview
Moving Averages
Exponential Moving Averages:
- MA 10: 0.1729 | Bearish crossover
- MA 20: 0.1720 | Bearish crossover
- MA 50: 0.1780 | Bearish crossover
Simple Moving Averages:
- MA 10: 0.1750 | Bearish crossover
- MA 20: 0.1719 | Bearish crossover
- MA 50: 0.1691 | Bearish crossover
Indicators
- RSI: 44.44 | Neutral Zone | Neutral
- Stochastic Oscillator: 27.15 | Sell Zone | Neutral
Resistance and Support Levels
- Resistance 1: 0.1892
- Resistance 2: 0.2041
- Support 1: 0.1408
- Support 2: 0.1259
Market Sentiment
- Overall Sentiment: Bearish
- Market Direction: Sell
Trade Suggestion
- Entry (Limit Sell): 0.171
- Take Profit: 0.154
- Stop Loss: 0.186
Broader Market Snapshot
- Bitcoin: Down 0.82% at 93,947
- Ethereum: Down 2.63% at 1,772.23
- Litecoin: Down 1.68% at 81.89
- Solana: Down 1.94% at 143.08
- Dogecoin: Down 2.67% at 0.166
Key Economic Events – May 3, 2025
- Australia Building Approvals (MoM) – April
- Forecast: -1.7%
- Previous: -0.2%
- Release Time: 07:00 (AUD)