

Major cryptocurrencies, including Bitcoin, Ethereum, XRP, and Cardano, continue to show resilience despite global trade-related uncertainties. Bitcoin holds steady near $95,000, Ethereum eyes a breakout above $1,861, XRP maintains strength above $2.23, and Cardano bulls push for further gains, keeping sentiment cautiously optimistic across the broader crypto market.
KEY HIGHLIGHTS
- Bitcoin Holds Steady Near $95K Amid ETF Inflows
- Ethereum Eyes Breakout Above Key $1,861 Resistance Level
- XRP Strengthens Above $2.23, Targets Higher Resistance Zones
- Cardano Bulls Push Toward Breakout Above $0.720 Level
Markets In Focus Today
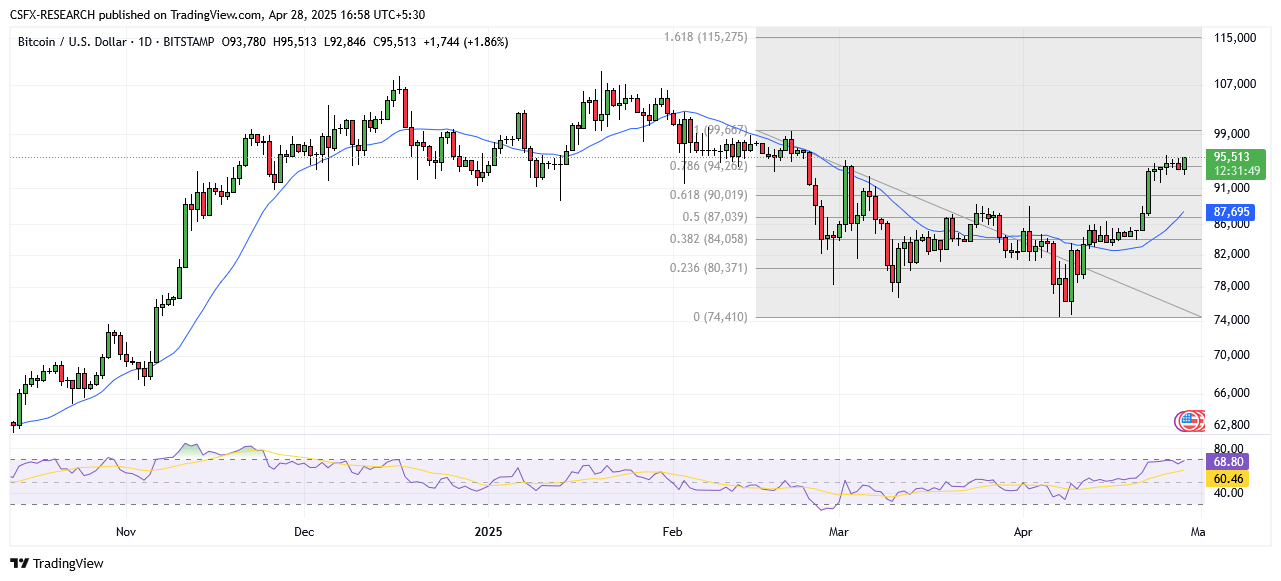
Bitcoin (BTC): Stable Near $95K with ETF Support
Market Overview
Bitcoin remains stable around $94,000, supported by robust inflows into spot exchange-traded funds (ETFs), which have helped offset trade uncertainty. Last week, Bitcoin broke above its 200-day Exponential Moving Average (EMA) at $85,000, rallying 11.14% through Friday.
- Current Price: ~$95,500
- Key Resistance: $96,000
- Key Support: $90,000 (psychological level)
Failure to close above $96,000 could trigger a pullback toward $90,000.
Technical Overview

Moving Averages:
- Exponential Moving Averages:
- MA 10: 92,082.53 | Positive Crossover | Bullish
- MA 20: 89,281.36 | Positive Crossover | Bullish
- MA 50: 87,587.99 | Positive Crossover | Bullish
- Simple Moving Averages:
- MA 10: 91,756.77 | Positive Crossover | Bullish
- MA 20: 87,706.02 | Positive Crossover | Bullish
- MA 50: 85,128.21 | Positive Crossover | Bullish
Indicators:
- Relative Strength Index (RSI): 68.76 | Buy Zone | Bullish
- Stochastic Oscillator: 90.63 | Buy Zone | Neutral
Resistance and Support Levels:
- Resistance 1 (R1): 92,792.63
- Resistance 2 (R2): 97,475.46
- Support 1 (S1): 77,632.94
- Support 2 (S2): 72,950.11
Sentiment: Bullish
Market Direction: Buy
Trade Suggestion:
- Limit Buy: 91,315.00
- Take Profit: 98,500.00
- Stop Loss: 87,542.00
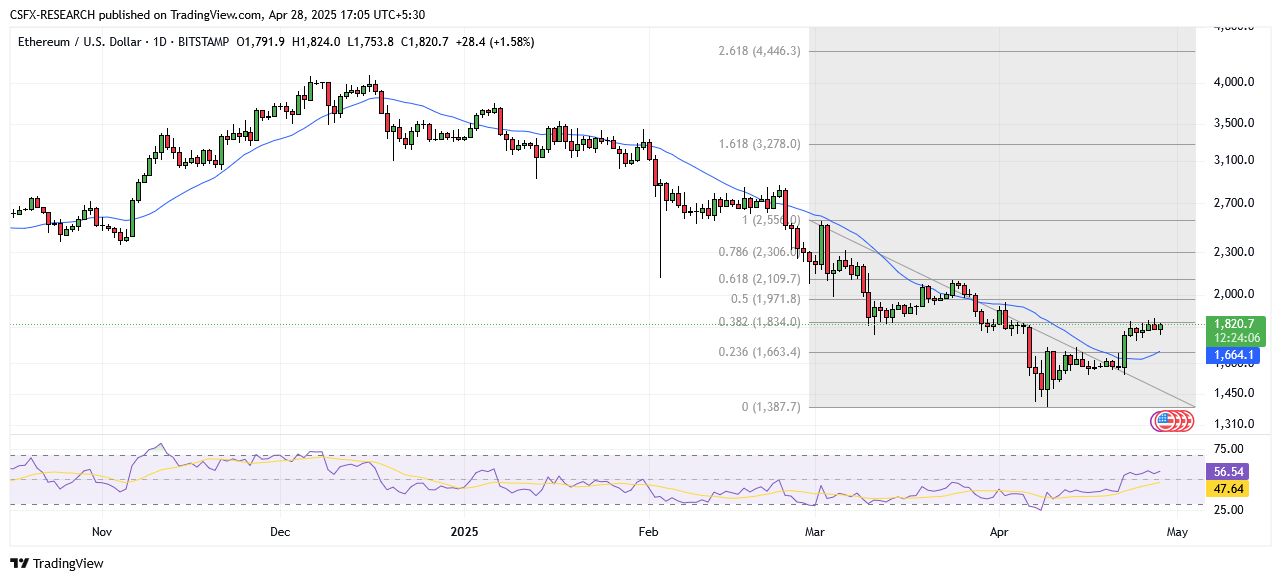
Ethereum (ETH): Consolidating Below $1,861 Resistance
Market Overview
Ethereum surged above the $1,700 resistance last week, posting a 14.86% rally through Saturday. However, it faced selling pressure near $1,861 and currently trades around $1,820. A breakout above $1,861 could lead to a move toward $2,000, while a failure to hold above $1,700 could open the door to deeper losses toward $1,449.
Technical Overview
Moving Averages:
- Exponential Moving Averages:
- MA 10: 1,749.83 | Positive Crossover | Bullish
- MA 20: 1,725.37 | Positive Crossover | Bullish
- MA 50: 1,866.65 | Negative Crossover | Bearish
- Simple Moving Averages:
- MA 10: 1,732.22 | Positive Crossover | Bullish
- MA 20: 1,663.97 | Positive Crossover | Bullish
- MA 50: 1,794.10 | Positive Crossover | Bullish
Indicators:
- Relative Strength Index (RSI): 56.58 | Buy Zone | Bullish
- Stochastic Oscillator: 87.43 | Buy Zone | Neutral
Resistance and Support Levels:
- Resistance 1 (R1): 2,343.13
- Resistance 2 (R2): 2,528.84
- Support 1 (S1): 1,741.93
- Support 2 (S2): 1,556.21
Sentiment: Neutral
Market Direction: Buy
Trade Suggestion:
- Limit Buy: 1,751.00
- Take Profit: 1,926.20
- Stop Loss: 1,669.40
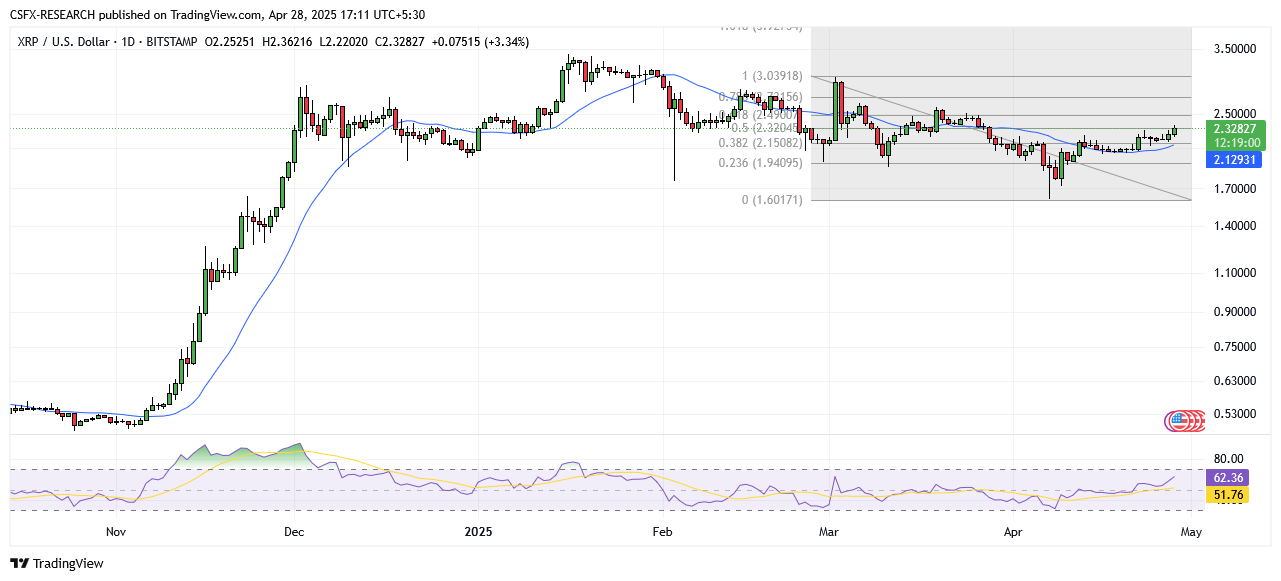
Ripple (XRP): Breaks Above $2.23, Targeting Further Upside
Market Overview
XRP closed above the key $2.23 resistance level, signaling a potential continuation of its uptrend. Trading near $2.32, XRP could extend its gains toward the March 24 high at $2.50, with potential for a further move toward $3.00.
Technical Overview
Moving Averages:
- Exponential Moving Averages:
- MA 10: 2.2004 | Positive Crossover | Bullish
- MA 20: 2.1640 | Positive Crossover | Bullish
- MA 50: 2.2052 | Positive Crossover | Bullish
- Simple Moving Averages:
- MA 10: 2.1842 | Positive Crossover | Bullish
- MA 20: 2.1288 | Positive Crossover | Bullish
- MA 50: 2.1878 | Positive Crossover | Bullish
Indicators:
- Relative Strength Index (RSI): 62.25 | Buy Zone | Bullish
- Stochastic Oscillator: 76.67 | Neutral
Resistance and Support Levels:
- Resistance 1 (R1): 2.7609
- Resistance 2 (R2): 3.0230
- Support 1 (S1): 1.9121
- Support 2 (S2): 1.6500
Sentiment: Bullish
Market Direction: Buy
Trade Suggestion:
- Limit Buy: 2.26
- Take Profit: 2.48
- Stop Loss: 2.15
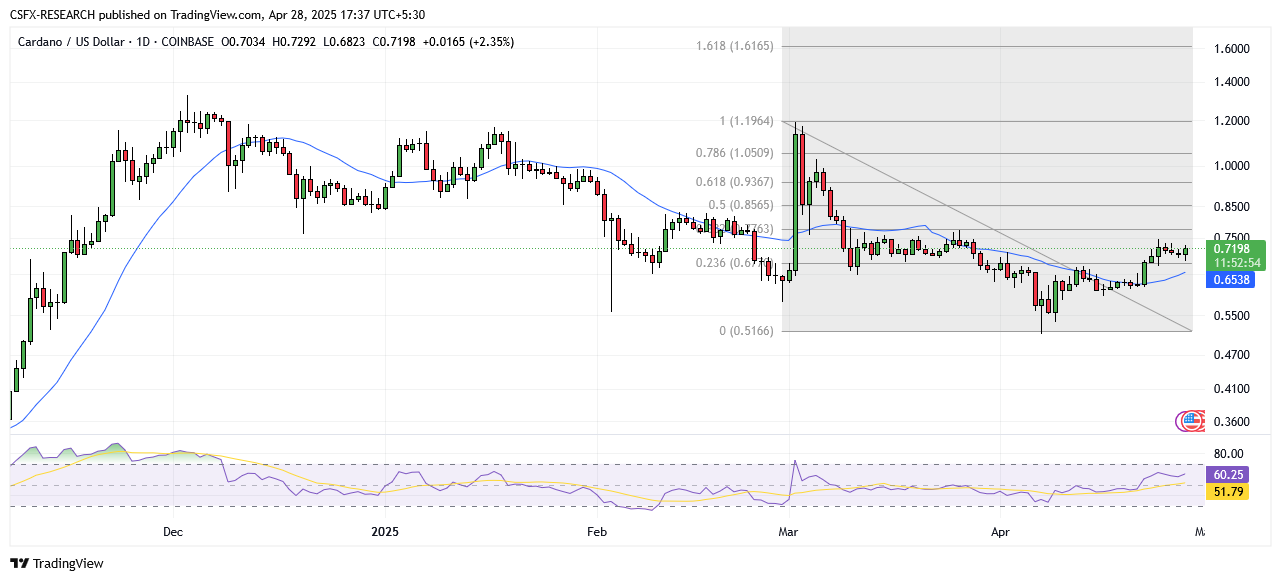
Cardano (ADA): Bulls Eyeing a Breakout Above $0.75
Market Overview
Cardano is consolidating near $0.70 after rebounding from the $0.620 area. ADA is currently trading above $0.680 and the 100-hour simple moving average. A close above the $0.750 resistance could trigger a fresh rally, while failure to break higher could lead to another decline toward $0.70.
Technical Overview
Moving Averages:
- Exponential Moving Averages:
- MA 10: 0.6881 | Positive Crossover | Bullish
- MA 20: 0.6714 | Positive Crossover | Bullish
- MA 50: 0.6883 | Positive Crossover | Bullish
- Simple Moving Averages:
- MA 10: 0.6815 | Positive Crossover | Bullish
- MA 20: 0.6537 | Positive Crossover | Bullish
- MA 50: 0.6750 | Positive Crossover | Bullish
Indicators:
- Relative Strength Index (RSI): 60.12 | Buy Zone | Bullish
- Stochastic Oscillator: 76.15 | Buy Zone | Neutral
Resistance and Support Levels:
- Resistance 1 (R1): 1.0307
- Resistance 2 (R2): 1.1603
- Support 1 (S1): 0.6113
- Support 2 (S2): 0.4817
Sentiment: Bullish
Market Direction: Buy
Trade Suggestion:
- Limit Buy: 0.690
- Take Profit: 0.774
- Stop Loss: 0.652
Elsewhere in the Crypto Market
- Bitcoin up 1.45% at 95,130
- Ethereum up 0.96% at 1,808.89
- Litecoin up 1.69% at 86.83
- Solana down 0.25% at 151.08
- Dogecoin up 0.74% at 0.180
Key Economic Events & Data Release Today
- CAD Wholesale Sales (MoM) (March): Previous reading at 0.3%, release scheduled for 17:30 GMT.