

KEY HIGHLIGHTS
- Bitcoin Falls Below $97K Amid Hawkish Fed Outlook.
- Ethereum Drops 20% From Monday High Amid Selloff.
- XRP Slips 10% Following Bearish Market Sentiment.
- Cardano Declines 10%, Continues Downtrend Amid Pressure.
INTRODUCTION
The cryptocurrency market faced a significant downturn this week, driven by macroeconomic uncertainties and profit-taking following record highs. Bitcoin fell below the $97,000 mark, marking its third consecutive day of losses, while Ethereum experienced a sharp 20% drop from its Monday peak. The Federal Reserve’s hawkish stance, signaling a slower pace of rate cuts in 2025, further weighed on the market, reducing liquidity and diminishing the appeal of speculative assets like cryptocurrencies.
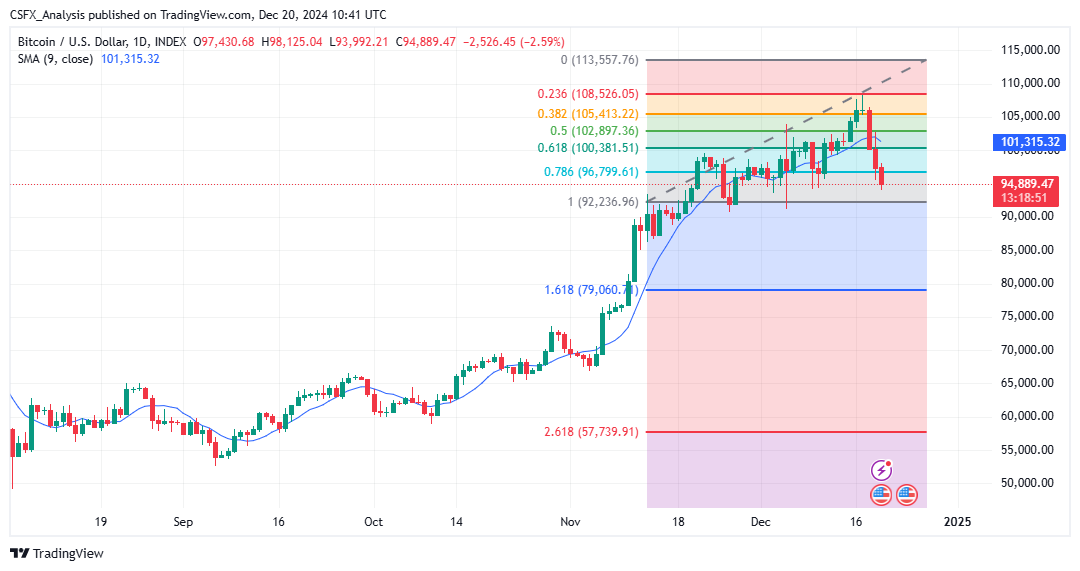
Bitcoin Analysis Bitcoin, the world’s largest cryptocurrency, hit an all-time high of $108,244.9 earlier this week before retreating sharply. By Friday, Bitcoin had fallen 3.7% to $97,002.0, extending its losing streak to three days. The Fed’s cautious approach to interest rate cuts and profit-taking amid record highs triggered this decline.
Technical Overview:
- Exponential Moving Averages (EMA):
- MA 10: $99,872.9865 | Negative Crossover | Bearish
- MA 20: $98,885.9505 | Negative Crossover | Bearish
- MA 50: $91,857.0388 | Positive Crossover | Bullish
- Simple Moving Averages (SMA):
- MA 10: $101,182.6420 | Negative Crossover | Bearish
- MA 20: $99,545.4350 | Negative Crossover | Bearish
- MA 50: $91,629.9748 | Positive Crossover | Bullish
- RSI (Relative Strength Index): 44.2698 | Neutral
- Stochastic Oscillator: 26.0593 | Neutral
- Resistance Levels: R1: $99,880.3991 | R2: $107,546.9676
- Support Levels: S1: $75,061.5076 | S2: $67,394.9391
Suggested Trade:
- Limit Buy: $94,382.1200
- Take Profit: $67,394.9391
- Stop Loss: $122,152.5350
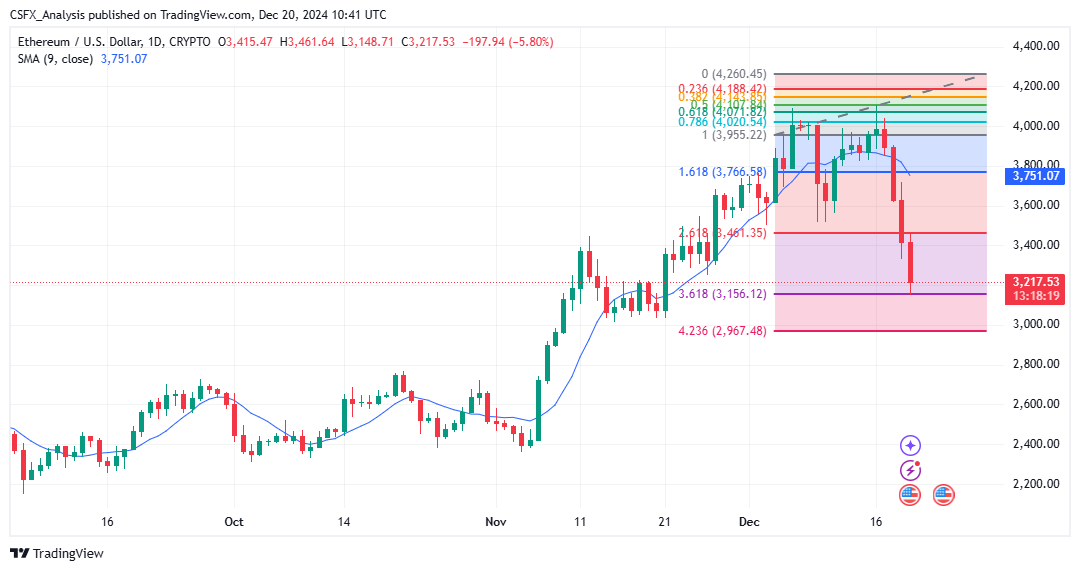
Ethereum Analysis Ethereum, the second-largest cryptocurrency, experienced a steep decline this week, plunging from a Monday high of $4,100 to a Friday session low of $3,260—a 20% drop. Broad market selloffs and macroeconomic pressures were the key drivers of this dramatic downturn.
Technical Overview:
- Exponential Moving Averages (EMA):
- MA 10: $3,655.0924 | Negative Crossover | Bearish
- MA 20: $3,672.7013 | Negative Crossover | Bearish
- MA 50: $3,429.8238 | Negative Crossover | Bearish
- Simple Moving Averages (SMA):
- MA 10: $3,757.3290 | Negative Crossover | Bearish
- MA 20: $3,776.7415 | Negative Crossover | Bearish
- MA 50: $3,380.0430 | Negative Crossover | Bearish
- RSI (Relative Strength Index): 35.9758 | Neutral
- Stochastic Oscillator: 11.7425 | Neutral
- Resistance Levels: R1: $3,795.3931 | R2: $4,121.3469
- Support Levels: S1: $2,740.1869 | S2: $2,414.2331
Suggested Trade:
- Limit Buy: $3,199.1500
- Take Profit: $2,414.2331
- Stop Loss: $4,758.5850
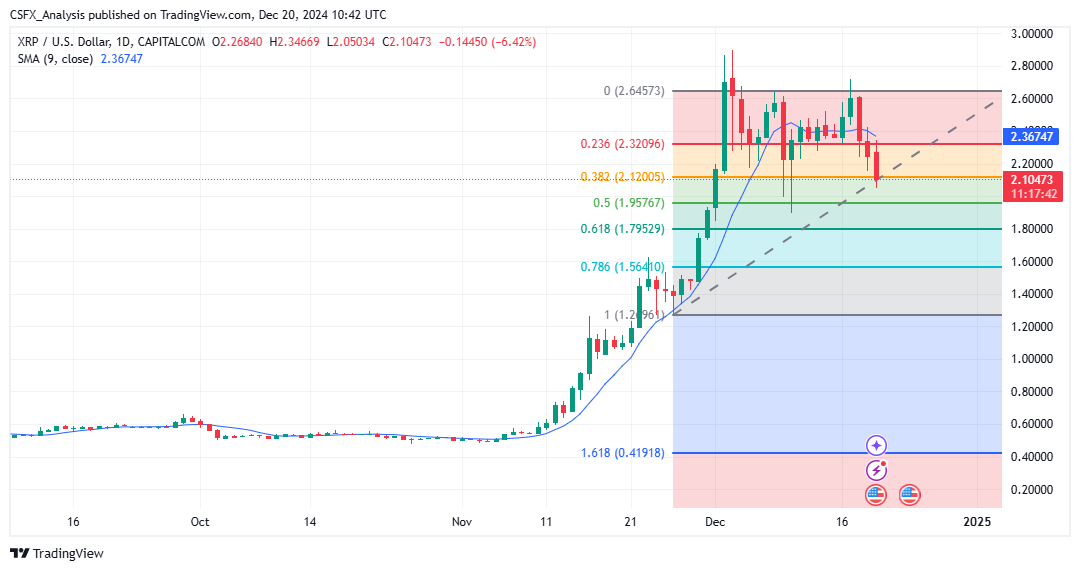
Ripple Analysis Ripple (XRP) fell 10.31% on Friday, trading at $2.1385. The decline reduced XRP’s market cap to $125.4863 billion, a significant drop from its peak of $155.2807 billion. Over the past week, XRP has lost 5.14%, trading in a range of $2.1371 to $2.7239.
Technical Overview:
- Exponential Moving Averages (EMA):
- MA 10: $2.3228 | Negative Crossover | Bearish
- MA 20: $2.2256 | Negative Crossover | Bearish
- MA 50: $1.7478 | Positive Crossover | Bullish
- Simple Moving Averages (SMA):
- MA 10: $2.3702 | Negative Crossover | Bearish
- MA 20: $2.4042 | Negative Crossover | Bearish
- MA 50: $1.5562 | Positive Crossover | Bullish
- RSI (Relative Strength Index): 49.9534 | Neutral
- Stochastic Oscillator: 38.2734 | Neutral
- Resistance Levels: R1: $2.0280 | R2: $2.3742
- Support Levels: S1: $0.9070 | S2: $0.5608
Suggested Trade:
- Limit Buy: $2.1053
- Take Profit: $0.5608
- Stop Loss: $3.0561
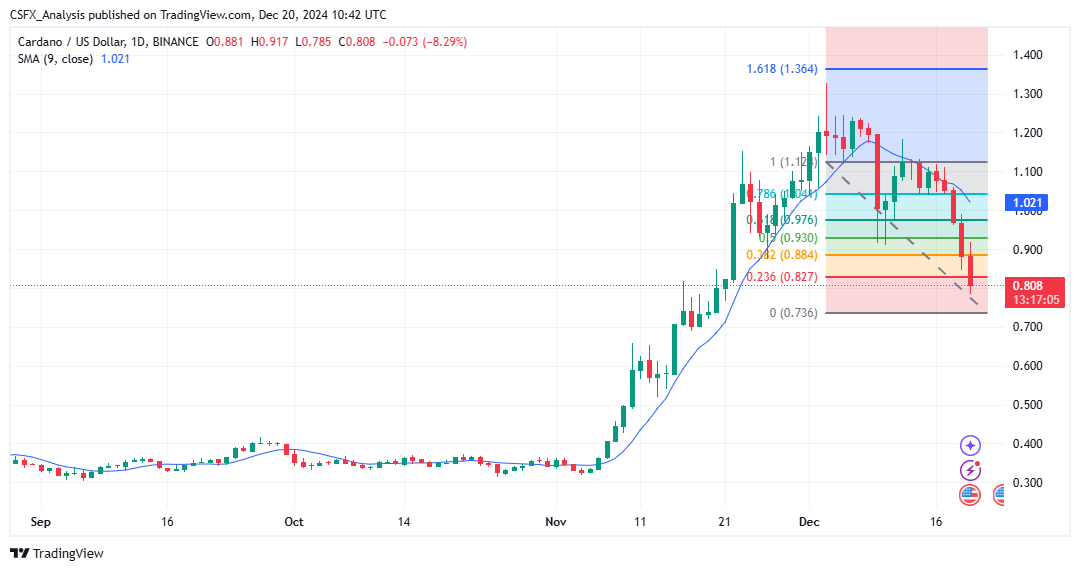
Cardano Analysis Cardano (ADA) dropped 10.10% on Friday to $0.8849, marking its largest one-day percentage loss since December 9. Cardano’s market cap fell to $31.4762 billion, a steep decline from its peak of $94.8001 billion. The token traded within $0.8691 to $0.9177 over the past 24 hours and has lost 18.53% over the last seven days.
Technical Overview:
- Exponential Moving Averages (EMA):
- MA 10: $0.9909 | Negative Crossover | Bearish
- MA 20: $1.0142 | Negative Crossover | Bearish
- MA 50: $0.8819 | Negative Crossover | Bearish
- Simple Moving Averages (SMA):
- MA 10: $1.0272 | Negative Crossover | Bearish
- MA 20: $1.0916 | Negative Crossover | Bearish
- MA 50: $0.8527 | Negative Crossover | Bearish
- RSI (Relative Strength Index): 35.0938 | Neutral
- Stochastic Oscillator: 9.9893 | Neutral
- Resistance Levels: R1: $1.1689 | R2: $1.3655
- Support Levels: S1: $0.5325 | S2: $0.3359
Suggested Trade:
- Limit Buy: $0.8030
- Take Profit: $0.3359
- Stop Loss: $1.7408
Conclusion The cryptocurrency market remains under pressure, with Bitcoin and Ethereum leading the declines. Ripple and Cardano also face significant bearish sentiment amid heightened macroeconomic uncertainties. Investors should closely monitor technical levels and broader market trends to navigate this volatile environment effectively.