

Cryptocurrencies are trading under pressure as broader market uncertainties—driven by ongoing U.S.-China trade tensions and weak global sentiment—continue to weigh on investor appetite. Key assets like Bitcoin, Ethereum, XRP, and Dogecoin face critical technical hurdles, with downside risks mounting if major support levels fail to hold.
KEY HIGHLIGHTS
- Bitcoin dips under $95K amid trade tensions and uncertainty.
- Ethereum eyes $1,700 as bearish pressure builds near resistance.
- Ripple slips below $2.20, risks further downside toward $1.96.
- Dogecoin drops below $0.1750, struggles to regain bullish footing.
Bitcoin (BTC)
Market Summary
- Current Price: $94,141
- Trend: Consolidating in a tight range as investors await clearer signals on U.S.-China trade negotiations and global economic direction.
- Recent Price Range: $92,000 – $97,000
Despite gains in late April due to improved risk appetite, sentiment has cooled amid uncertainty. With U.S. President Trump stating that no immediate talks are planned with President Xi but confirming ongoing communication, risk-off sentiment continues to pressure speculative assets like Bitcoin.
Technical Overview


Moving Averages
Exponential
- MA 10: 94,372.90 | Negative Crossover – Bearish
- MA 20: 92,241.38 | Positive Crossover – Bullish
- MA 50: 89,439.17 | Positive Crossover – Bullish
Simple
- MA 10: 95,006.25 | Negative Crossover – Bearish
- MA 20: 91,862.40 | Positive Crossover – Bullish
- MA 50: 86,903.16 | Positive Crossover – Bullish
Indicators
- RSI: 59.84 | Buy Zone – Bullish
- Stochastic Oscillator: 74.34 | Buy Zone – Neutral
Resistance & Support Levels
- Resistance: R1: 96,352.96 | R2: 101,420.45
- Support: S1: 79,948.01 | S2: 74,880.52
Sentiment & Trade Strategy
- Overall Sentiment: Bullish
- Market Direction: Buy
- Trade Suggestion:
- Limit Buy: 90,813
- Take Profit: 97,965
- Stop Loss: 87,630
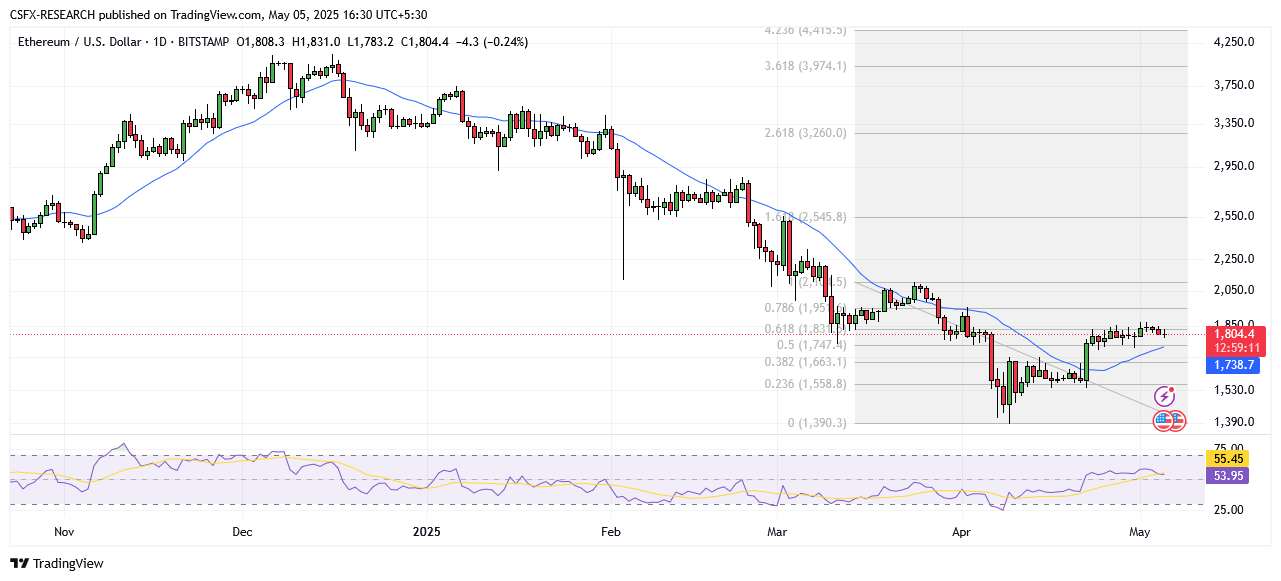
Ethereum (ETH)
Market Summary
- Current Price: $1,803.75
- Recent Movement: Down 1.87% from Friday’s resistance near $1,861
- Key Level to Watch: $1,700 (psychological support)
A decisive close below $1,700 could signal deeper declines toward $1,449. Alternatively, a break above $1,861 could lead to a move toward $2,000.
Technical Overview
Moving Averages
Exponential
- MA 10: 1,800.87 | Positive Crossover – Bullish
- MA 20: 1,771.42 | Positive Crossover – Bullish
- MA 50: 1,854.30 | Negative Crossover – Bearish
Simple
- MA 10: 1,814.12 | Negative Crossover – Bearish
- MA 20: 1,738.90 | Positive Crossover – Bullish
- MA 50: 1,782.18 | Positive Crossover – Bullish
Indicators
- RSI: 54.31 | Buy Zone – Bullish
- Stochastic Oscillator: 83.27 | Buy Zone – Neutral
Resistance & Support Levels
- Resistance: R1: 1,928.82 | R2: 2,063.15
- Support: S1: 1,493.96 | S2: 1,359.63
Sentiment & Trade Strategy
- Overall Sentiment: Neutral
- Market Direction: Buy
- Trade Suggestion:
- Limit Buy: 1,728.5
- Take Profit: 1,955.3
- Stop Loss: 1,619.7
Ripple (XRP)
Market Summary
- Current Price: $2.14
- Key Observation: Closed below its 50-day EMA at $2.20
- Risk: Further decline toward $1.96 if bearish momentum persists
A break above $2.20 may lead to a retest of the March 24 high at $2.50 and potentially $3.00.
Technical Overview

Moving Averages
Exponential
- MA 10: 2.1877 | Negative Crossover – Bearish
- MA 20: 2.1755 | Negative Crossover – Bearish
- MA 50: 2.2012 | Negative Crossover – Bearish
Simple
- MA 10: 2.2103 | Negative Crossover – Bearish
- MA 20: 2.1689 | Negative Crossover – Bearish
- MA 50: 2.1797 | Negative Crossover – Bearish
Indicators
- RSI: 48.80 | Neutral Zone – Neutral
- Stochastic Oscillator: 37.20 | Sell Zone – Neutral
Resistance & Support Levels
- Resistance: R1: 2.3417 | R2: 2.5181
- Support: S1: 1.7707 | S2: 1.5943
Sentiment & Trade Strategy
- Overall Sentiment: Bearish
- Market Direction: Sell
- Trade Suggestion:
- Limit Buy: 2.19
- Take Profit: 2.09
- Stop Loss: 2.25
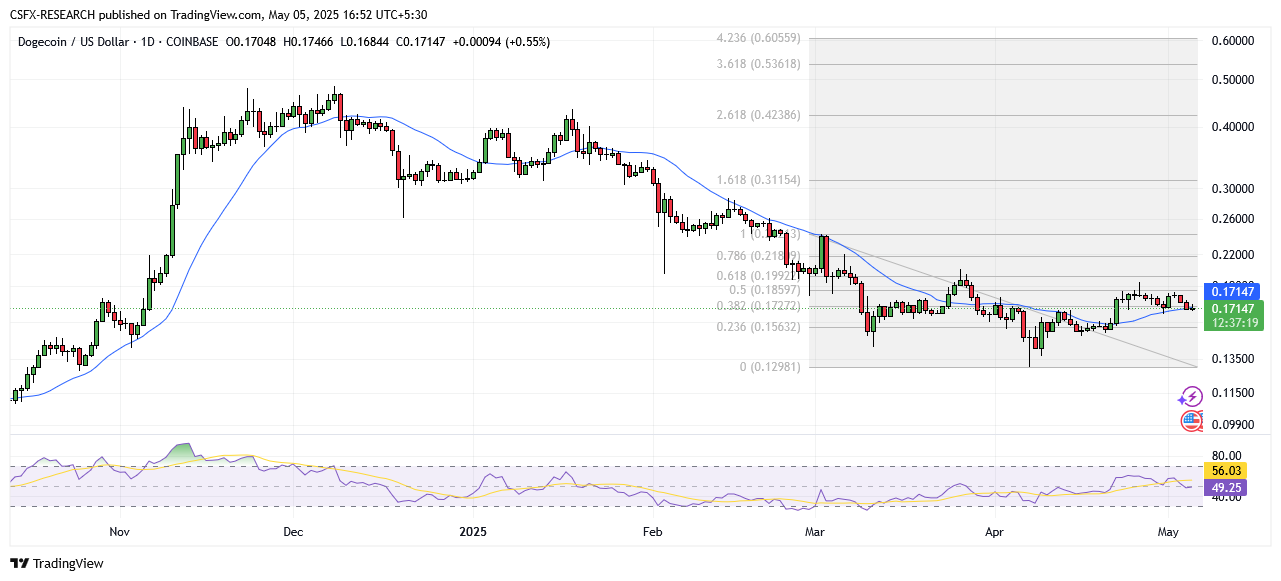
Dogecoin (DOGE)
Market Summary
- Current Price: $0.170
- Recent Action: Failed to break $0.1880 resistance and has declined
- Risk: A decisive break below $0.1600 may lead to further downside
DOGE is facing resistance near $0.1740. If this level is not cleared, price could revisit supports at $0.1685 or $0.1650.
Technical Overview
Moving Averages
Exponential
- MA 10: 0.1747 | Negative Crossover – Bearish
- MA 20: 0.1728 | Negative Crossover – Bearish
- MA 50: 0.1786 | Negative Crossover – Bearish
Simple
- MA 10: 0.1768 | Negative Crossover – Bearish
- MA 20: 0.1715 | Positive Crossover – Bullish
- MA 50: 0.1693 | Positive Crossover – Bullish
Indicators
- RSI: 49.62 | Buy Zone – Neutral
- Stochastic Oscillator: 46.23 | Neutral Zone – Neutral
Resistance & Support Levels
- Resistance: R1: 0.1892 | R2: 0.2041
- Support: S1: 0.1408 | S2: 0.1259
Sentiment & Trade Strategy
- Overall Sentiment: Bearish
- Market Direction: Sell
- Trade Suggestion:
- Limit Sell: 0.175
- Take Profit: 0.164
- Stop Loss: 0.182
Broader Crypto Market Update
- Bitcoin: Down 0.19% at $94,141
- Ethereum: Down 0.26% at $1,803.75
- Litecoin: Up 1.26% at $87.56
- Solana: Down 2.47% at $144.44
- Dogecoin: Up 0.28% at $0.170
Key Economic Events Today
Swiss Franc (CHF)
- CPI (MoM) – April
- Forecast: 0.2%
- Previous: 0.0%
- Time: 12:00
United States Dollar (USD)
- S&P Global Services PMI – April
- Forecast: 51.4
- Previous: 54.4
- Time: 19:15
- ISM Non-Manufacturing PMI – April
- Forecast: 50.2
- Previous: 50.8
- Time: 19:30