

The cryptocurrency market continues to face selling pressure, with Bitcoin sliding to $84K amid ongoing uncertainty regarding U.S. interest rates and trade tariffs. Major altcoins, including Ethereum, XRP, and Dogecoin, are struggling to maintain key support levels, as traders remain cautious, closely watching for potential rebounds or further declines.
KEY HIGHLIGHTS
- Bitcoin Slips to $84K Amid Fed and Tariff Uncertainty.
- Ethereum Holds Support, Eyes Rebound Toward $2,258 Level.
- XRP Retests Support, Potential Upside Toward $2.72 Possible.
- Dogecoin Struggles, Volatility Increases Amid Market Weakness.
BItcoin (BTC) Market Analysis
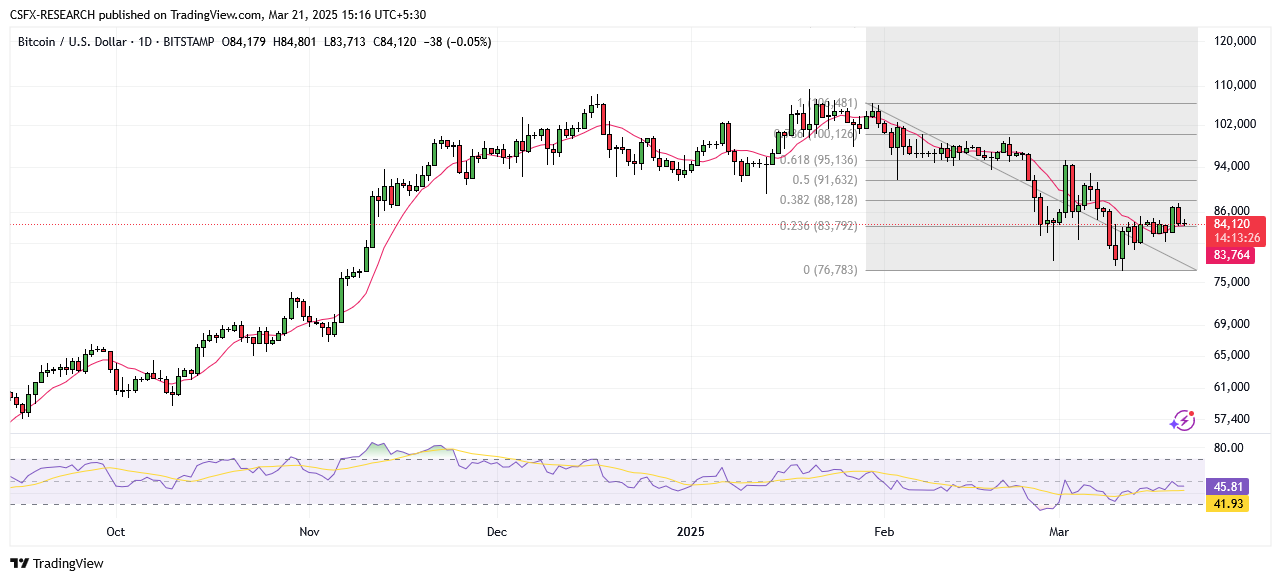
Bitcoin Price Drops to $84K as Market Uncertainty Grows
Bitcoin extended its decline on Friday, reflecting broader risk asset weakness amid rising concerns over U.S. interest rates and trade tariffs. Despite expectations of relief from crypto-friendly policies under U.S. President Donald Trump, the overall sentiment remains bearish.
BTC’s downward movement is closely linked to Wall Street’s losses, as traders reconsidered expectations for near-term Federal Reserve rate cuts. The central bank’s decision to hold interest rates steady further fueled economic uncertainty, weighing heavily on the cryptocurrency market.
Technical Analysis

Moving Averages
Exponential Moving Averages:
- MA 10: 84,238.27 | Bearish (Negative Crossover)
- MA 20: 85,414.86 | Bearish (Negative Crossover)
- MA 50: 89,461.82 | Bearish (Negative Crossover)
Simple Moving Averages:
- MA 10: 83,781.27 | Bullish (Positive Crossover)
- MA 20: 85,081.14 | Bearish (Negative Crossover)
- MA 50: 91,191.26 | Bearish (Negative Crossover)
Indicators
- RSI (Relative Strength Index): 45.73 | Neutral
- Stochastic Oscillator: 61.12 | Neutral
Support and Resistance Levels
- Resistance: R1: 97,945.13 | R2: 103,787.45
- Support: S1: 79,031.84 | S2: 73,189.52
Market Sentiment & Trade Recommendation
- Overall Sentiment: Bearish
- Market Direction: Sell
- Trade Suggestion: Limit Sell: 85,272 | Take Profit: 81,627 | Stop Loss: 87,528
Ethereum (ETH) Market Analysis
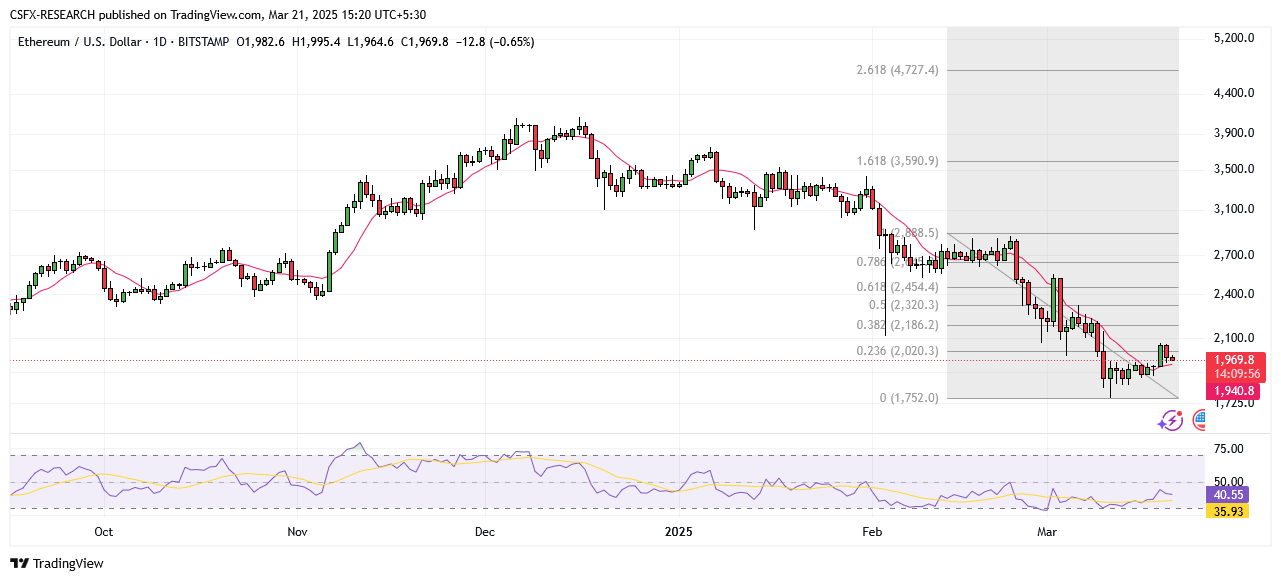
Ethereum Price Holds $1,861 Support, Eyes Potential Recovery
Ethereum found key support at $1,861 last week, rebounding 9% before slipping 3.5% on Thursday. Currently, ETH is trading around $1,970. If the $1,861 support holds, Ethereum could extend its recovery toward the March 7 high of $2,258. However, a break below this level may push ETH towards $1,700.
Technical Analysis
Moving Averages
Exponential Moving Averages:
- MA 10: 1,980.04 | Bearish (Negative Crossover)
- MA 20: 2,070.02 | Bearish (Negative Crossover)
- MA 50: 2,384.46 | Bearish (Negative Crossover)
Simple Moving Averages:
- MA 10: 1,938.87 | Bullish (Positive Crossover)
- MA 20: 2,041.68 | Bearish (Negative Crossover)
- MA 50: 2,422.01 | Bearish (Negative Crossover)
Indicators
- RSI: 58.57 | Neutral
- Stochastic Oscillator: 47.44 | Neutral
Support and Resistance Levels
- Resistance: R1: 3,028.38 | R2: 3,324.48
- Support: S1: 2,069.82 | S2: 1,773.72
Market Sentiment & Trade Recommendation
- Overall Sentiment: Neutral
- Market Direction: Buy
- Trade Suggestion: Limit Buy: 1,957.0 | Take Profit: 2,070.1 | Stop Loss: 1,898.5
Ripple (XRP) Market Analysis
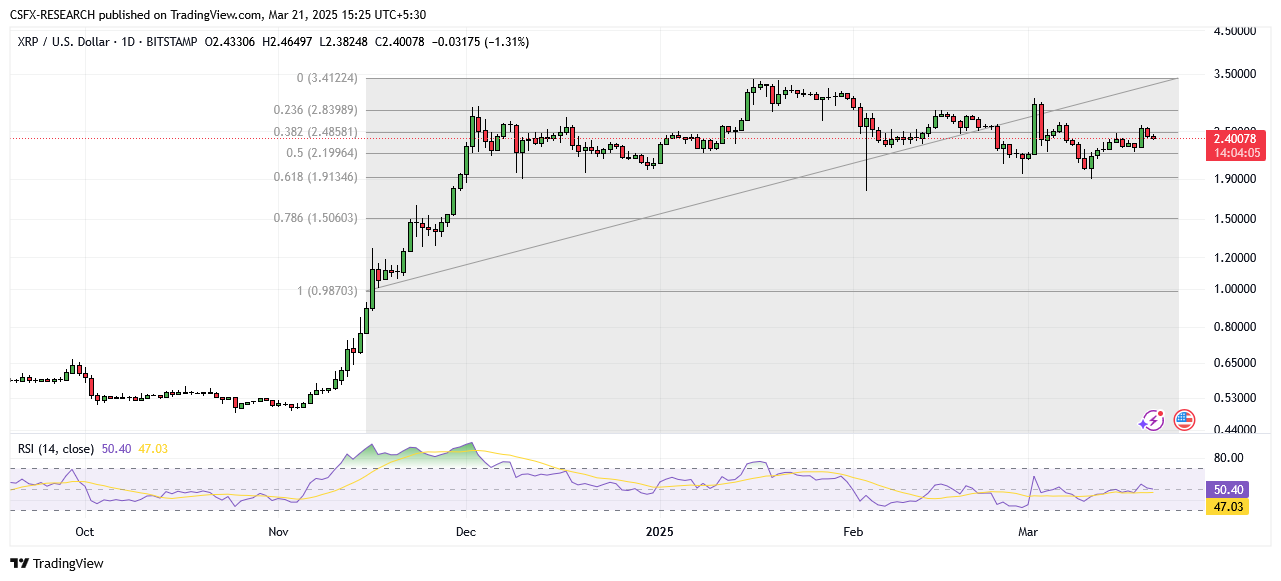
XRP Retests $2.40 Support, Potential Rebound Ahead
Ripple (XRP) surged 11.46% on Wednesday after breaking above the 50-day EMA at $2.43 but pulled back the following day to retest this level. As of Friday, XRP is trading near $2.42, showing signs of resilience. If support at the 50-day EMA holds, XRP could extend gains toward $2.72. However, a breakdown could lead to further losses toward $1.96.
Technical Analysis
Moving Averages
Exponential Moving Averages:
- MA 10: 2.3731 | Bullish (Positive Crossover)
- MA 20: 2.3728 | Bullish (Positive Crossover)
- MA 50: 2.4317 | Bearish (Negative Crossover)
Indicators
- RSI: 50.44 | Bullish
- Stochastic Oscillator: 77.38 | Neutral
Support and Resistance Levels
- Resistance: R1: 2.8249 | R2: 3.1263
- Support: S1: 1.8491 | S2: 1.5477
Market Sentiment & Trade Recommendation
- Overall Sentiment: Neutral
- Market Direction: Buy
- Trade Suggestion: Limit Buy: 2.36 | Take Profit: 2.59 | Stop Loss: 2.24
Dogecoin (DOGE) Market Analysis
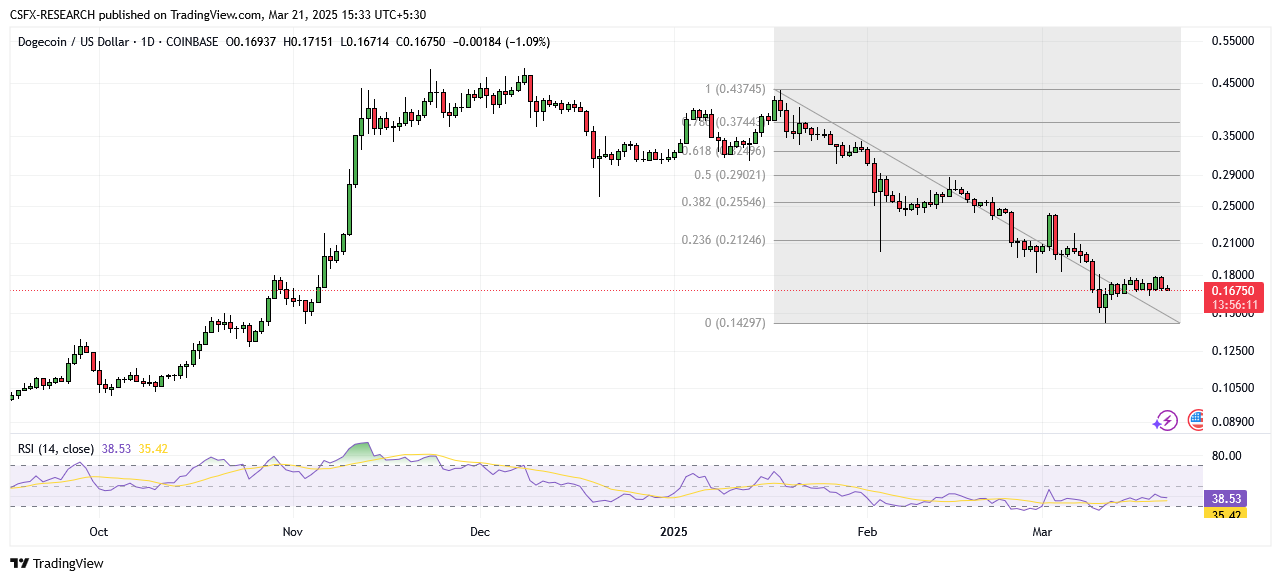
Dogecoin Faces Selling Pressure Amid Volatility
Dogecoin (DOGE) remains under short-term pressure, struggling to hold key support levels. Recently, DOGE dipped to $0.14 amid broader market weakness but is now showing signs of a potential recovery, currently trading at $0.1699.
Technical Analysis
Moving Averages
Exponential Moving Averages:
- MA 10: 0.1728 | Bearish (Negative Crossover)
- MA 20: 0.1835 | Bearish (Negative Crossover)
- MA 50: 0.2217 | Bearish (Negative Crossover)
Indicators
- RSI: 38.61 | Bearish
- Stochastic Oscillator: 42.98 | Neutral
Support and Resistance Levels
- Resistance: R1: 0.2959 | R2: 0.3315
- Support: S1: 0.1809 | S2: 0.1453
Market Sentiment & Trade Recommendation
- Overall Sentiment: Bearish
- Market Direction: Sell
- Trade Suggestion: Limit Sell: 0.171 | Take Profit: 0.162 | Stop Loss: 0.176
Key Economic Events & Data Releases Today
- (CAD) Core Retail Sales (MoM) (Jan): Forecast -0.1%, Previous 2.7% (18:00 GMT)
- (CAD) Retail Sales (MoM) (Jan): Forecast -0.1%, Previous 2.7% (18:00 GMT)