

The cryptocurrency market kicked off the week on a bullish note, with Bitcoin soaring to $87,000 amid growing optimism over a softer U.S. tariff stance. Ethereum (ETH) and XRP also showed signs of recovery, while Dogecoin (DOGE) attempted to regain lost ground. Investors are closely monitoring key support and resistance levels for further market direction.
KEY HIGHLIGHTS
- Bitcoin Surges to $87K Amid Softer US Tariff Expectations.
- Ethereum Holds Support, Eyes Break Above Key Resistance.
- XRP Extends Rally as Key Resistance Level Approaches.
- Dogecoin Attempts Recovery After Falling Below Crucial Support.
Bitcoin Price Analysis ($BTC)
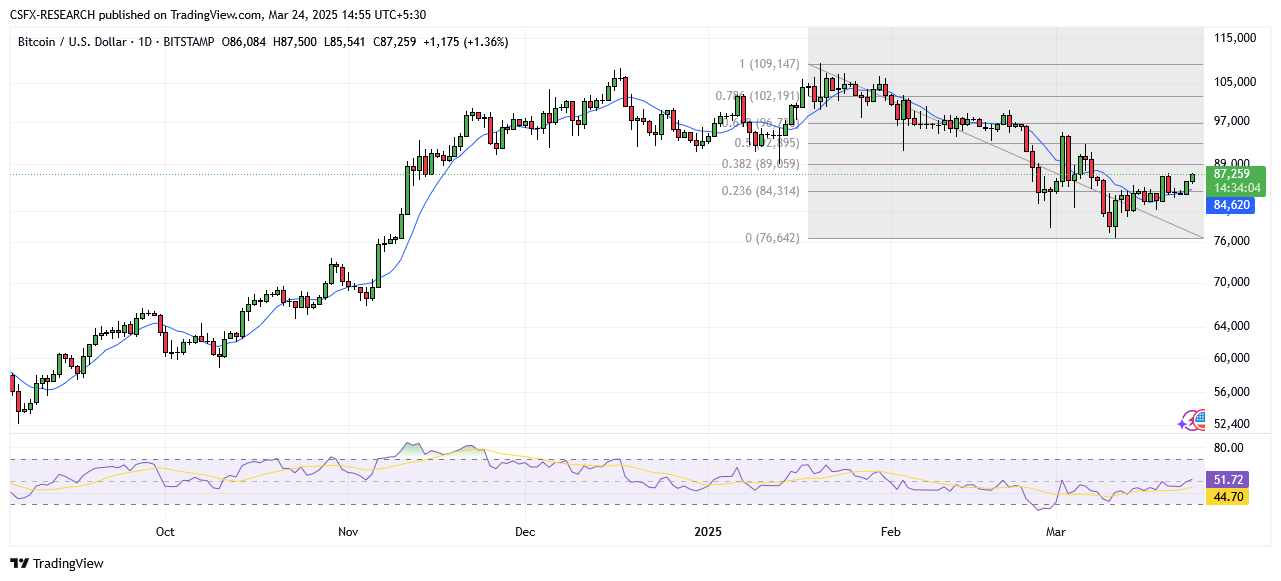
Bitcoin Surges to $87,000 as U.S. Tariff Concerns Ease
Bitcoin rallied at the start of the week as investors reacted positively to reports that U.S. President Donald Trump may adopt a more targeted approach to the trade tariffs set for April 2. Instead of imposing broad levies, the administration is expected to focus tariffs on specific countries with substantial trade imbalances, according to the Wall Street Journal.
Initially, uncertainty surrounding the tariffs weighed on risk assets, but growing optimism over a more measured strategy fueled Bitcoin’s momentum. Altcoins also followed suit, rising alongside Bitcoin.
Bitcoin Technical Overview

Moving Averages:
- Exponential:
- MA 10: 84,998.23 | Bullish (Positive Crossover)
- MA 20: 85,515.11 | Bullish (Positive Crossover)
- MA 50: 89,039.75 | Bearish (Negative Crossover)
- Simple:
- MA 10: 84,600.84 | Bullish (Positive Crossover)
- MA 20: 84,540.18 | Bullish (Positive Crossover)
- MA 50: 90,301.37 | Bearish (Negative Crossover)
Indicators:
- RSI (Relative Strength Index): 51.66 | Bullish (Buy Zone)
- Stochastic Oscillator: 83.46 | Neutral (Buy Zone)
Key Levels:
- Resistance: R1: 97,945.13, R2: 103,787.45
- Support: S1: 79,031.84, S2: 73,189.52
Overall Sentiment: Bullish
Market Direction: Buy
Trade Suggestion: Limit Buy: 85,737 | Take Profit: 88,995 | Stop Loss: 83,818
Ethereum Price Analysis ($ETH)
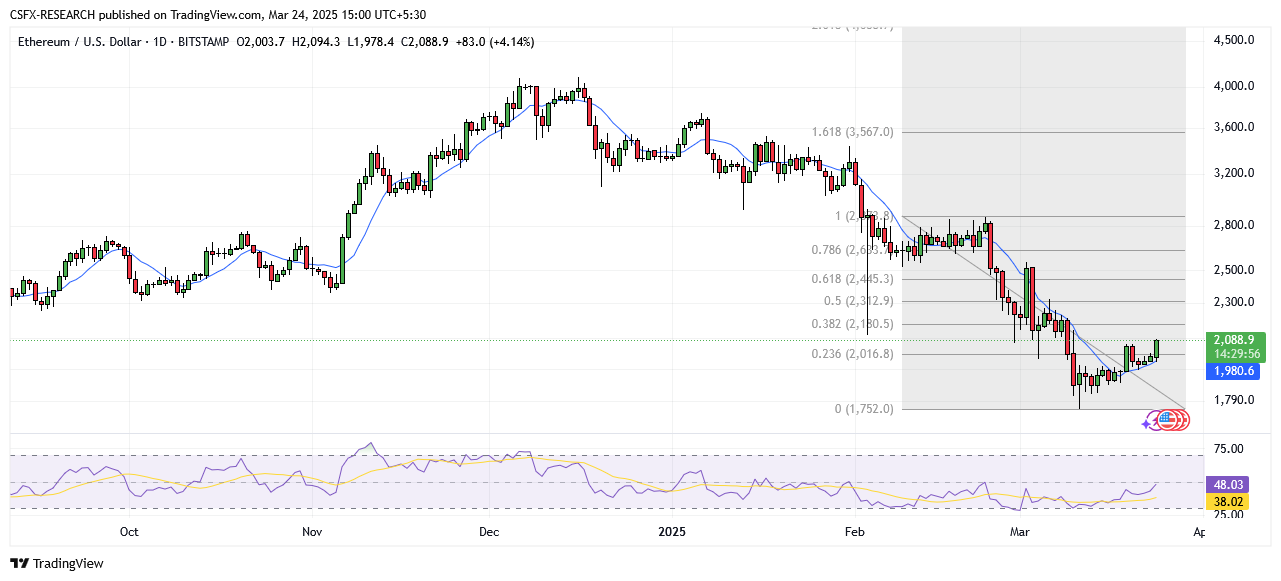
Ethereum Stabilizes Near $1,861, Eyes Recovery
Ethereum has repeatedly tested and held support near $1,861 over the past two weeks, rebounding nearly 7% last week. As of Monday, it trades around $2,090. If this key support level remains intact, ETH could extend its recovery toward the March 7 high of $2,258. However, a decisive break below $1,861 may trigger further downside, potentially pushing the price toward $1,700.
Ethereum Technical Overview
Moving Averages:
- Exponential:
- MA 10: 2,003.83 | Bullish (Positive Crossover)
- MA 20: 2,059.29 | Bullish (Positive Crossover)
- MA 50: 2,343.95 | Bearish (Negative Crossover)
- Simple:
- MA 10: 1,977.53 | Bullish (Positive Crossover)
- MA 20: 2,003.27 | Bullish (Positive Crossover)
- MA 50: 2,357.74 | Bearish (Negative Crossover)
Indicators:
- RSI (Relative Strength Index): 48.05 | Neutral
- Stochastic Oscillator: 69.74 | Neutral (Buy Zone)
Key Levels:
- Resistance: R1: 3,028.38, R2: 3,324.48
- Support: S1: 2,069.82, S2: 1,773.72
Overall Sentiment: Neutral
Market Direction: Buy
Trade Suggestion: Limit Buy: 2,038.00 | Take Profit: 2,135.50 | Stop Loss: 1,989.30
Ripple (XRP) Price Analysis
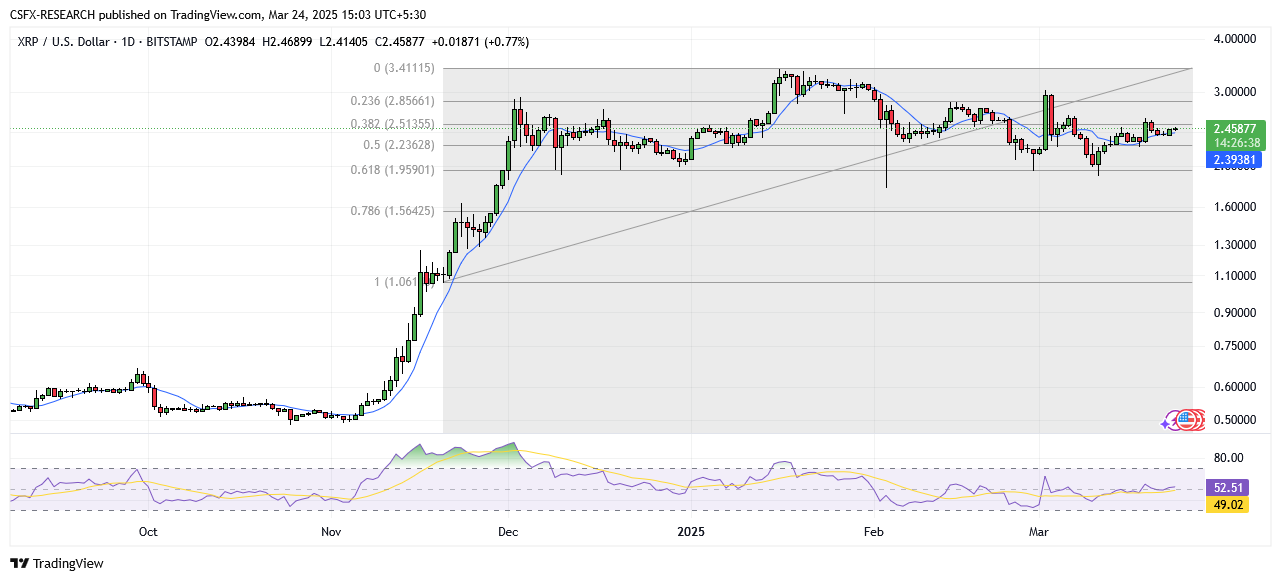
XRP Maintains Momentum Near $2.45
Ripple’s (XRP) price has been consolidating around $2.45, following a 7% surge last week. The next major hurdle is the 100-day EMA at $2.42. If this support level holds, XRP may target resistance at $2.72. Conversely, a drop below $2.42 could lead to a decline toward $1.96.
XRP Technical Overview
Moving Averages:
- Exponential & Simple: All indicate bullish trends
- RSI: 52.46 | Bullish
- Stochastic Oscillator: 75.21 | Neutral
Key Levels:
- Resistance: R1: 2.8249, R2: 3.1263
- Support: S1: 1.8491, S2: 1.5477
Overall Sentiment: Bullish
Market Direction: Buy
Trade Suggestion: Limit Buy: 2.41 | Take Profit: 2.55 | Stop Loss: 2.33
Dogecoin (DOGE) Price Analysis
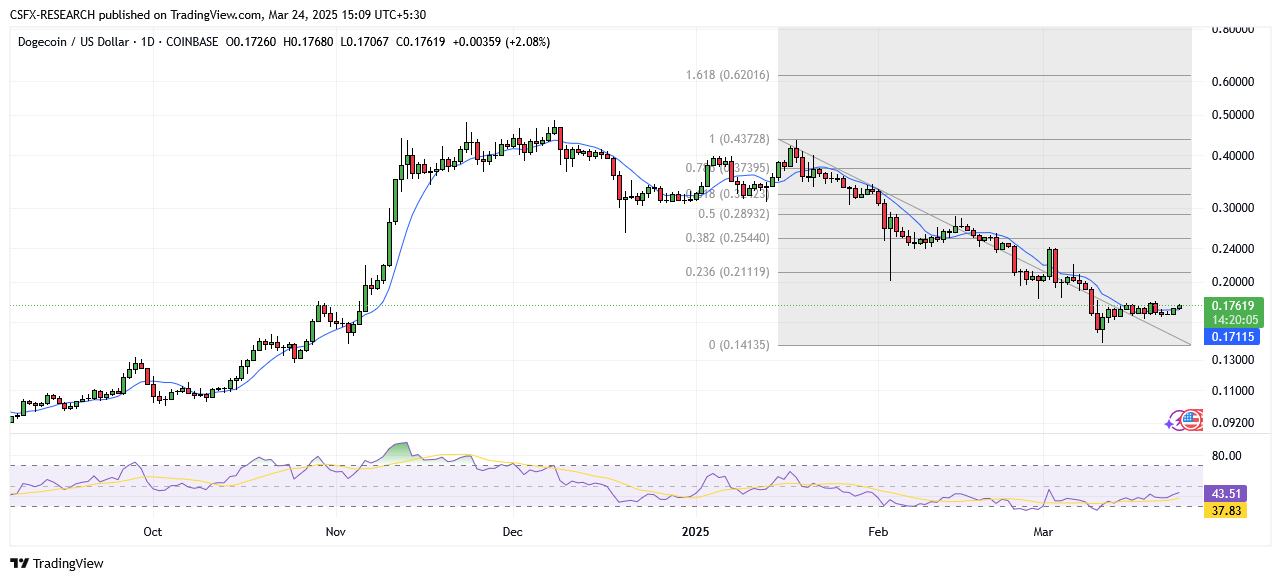
Dogecoin Eyes Recovery After Dropping Below $0.1720
Dogecoin (DOGE) slipped below key support levels at $0.1750, $0.1720, and $0.1700, briefly dipping to $0.1650. However, it is now trading above $0.1680 and the 100-hour simple moving average. Immediate resistance lies at $0.1755. Failure to break this level could push DOGE lower, with support at $0.1720 and $0.1680.
DOGE Technical Overview
Indicators:
- RSI: 43.61 | Neutral
- Stochastic Oscillator: 72.65 | Neutral
Key Levels:
- Resistance: R1: 0.2959, R2: 0.3315
- Support: S1: 0.1809, S2: 0.1453
Overall Sentiment: Neutral
Market Direction: Buy
Trade Suggestion: Limit Buy: 0.173 | Take Profit: 0.180 | Stop Loss: 0.170
Crypto Market Overview & Economic Events
- Bitcoin: Down (-1.46%) at $87,338
- Ethereum: Up (+4.09%) at $2,088.16
- Litecoin: Up (+0.99%) at $92.86
- Solana: Up (+5.22%) at $139.80
- Dogecoin: Up (+1.99%) at $0.176
Key Economic Events Today:
- (USD) S&P Global Manufacturing PMI (Mar): Forecast 51.9, Previous 52.7 (Release: 19:15)
- (USD) S&P Global Services PMI (Mar): Forecast 51.2, Previous 51.0 (Release: 19:15)