
Commodities are seeing mixed action today as global macroeconomic themes play out alongside localized trading cues. Gold and silver remain under pressure, while crude oil extends its decline amid reduced geopolitical risks. Natural gas shows resilience, holding above a key support level. With key U.S. economic data—like Core Retail Sales and Jobless Claims—due later in the New York session, and recent UK GDP data released during the London morning hours, market volatility is expected to persist. UK and U.S. traders should remain attentive to evolving global trends as well as local fundamentals.
KEY HIGHLIGHTS
- Gold Weakens Below $3,150 Ahead of Key U.S. Data
- Silver Drops Below $32, Bearish Momentum Gains Strength Daily
- Crude Oil Slumps on Iran Deal Hopes and Oversupply Fears
- Natural Gas Holds Support, Eyes Bullish Reversal Above $3.594
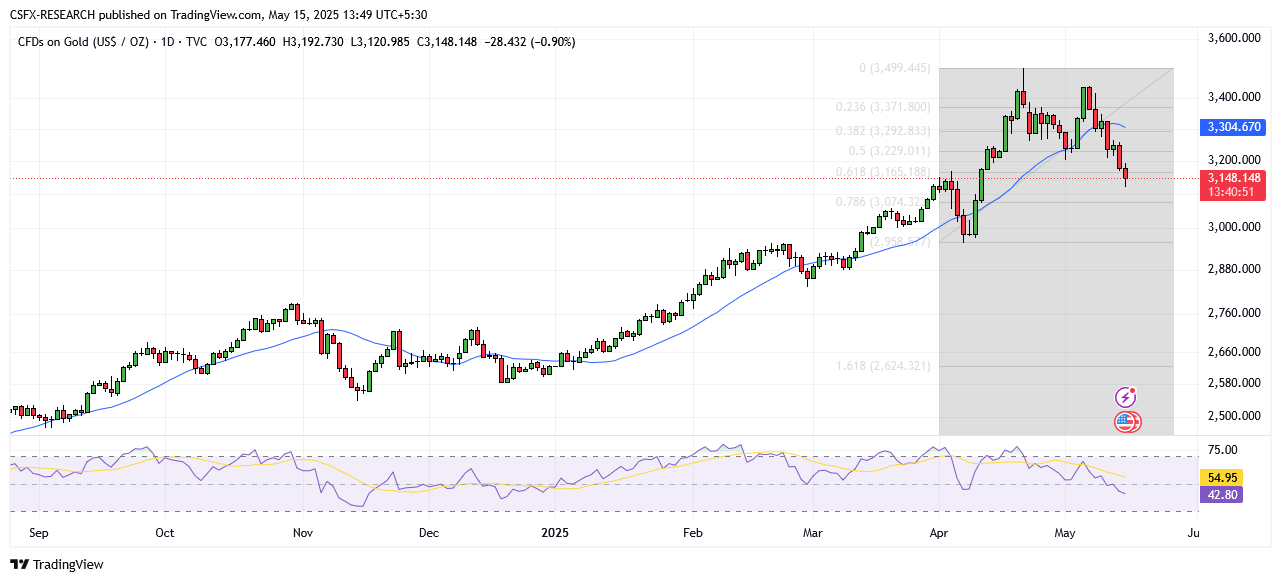
GOLD (XAU/USD)
Gold Under Pressure Despite Dollar Weakness Ahead of Key U.S. Data
Gold prices continue to trade below key resistance at $3,150, after a mild bounce from a one-month low. The weakness in the U.S. Dollar has not been enough to lift sentiment, as cautious anticipation of U.S. Producer Price Index (PPI) data and Fed Chair Powell’s remarks dominates the market.
In the UK and U.S. markets, gold remains a defensive asset, but traders in both regions are watching U.S. inflation cues closely, especially amid shifting expectations for interest rate easing.
Technical Overview


Moving Averages (Bearish Bias Across All Terms):
- Exponential MA 10: 3251.82
- Exponential MA 20: 3256.60
- Exponential MA 50: 3164.09
- Simple MA 10: 3281.96
- Simple MA 20: 3304.66
- Simple MA 50: 3154.57
Indicators:
- RSI: 42.77 (Neutral)
- Stochastic Oscillator: 10.59 (Sell Zone)
Key Levels:
- Resistance: R1 3456.05 | R2 3584.30
- Support: S1 3040.84 | S2 2912.59
Overall Sentiment: Bearish
Market Direction: Sell
Trade Suggestion:
- Entry: 3199.00
- Take Profit: 3080.20
- Stop Loss: 3287.50
SILVER (XAG/USD)
Silver Slides Below $32.00, Eyes Lower Levels as Momentum Weakens
Silver prices have fallen for the second straight day, now hovering around $31.90 during the London session. With bearish signals aligning and price action below short-term EMAs, traders in the UK and U.S. should remain cautious. A test of support near $30.88 may be imminent unless bulls reclaim short-term resistance.
Technical Overview
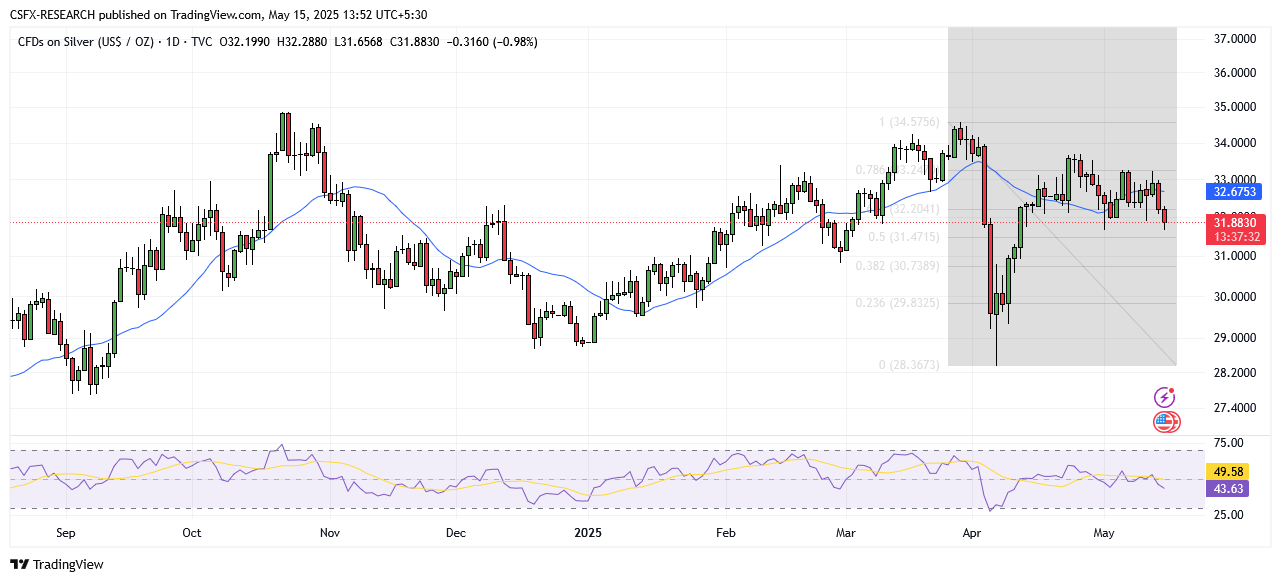
Moving Averages:
- Exponential MA 10: 32.44
- Exponential MA 20: 32.50
- Exponential MA 50: 32.00
- Simple MA 10: 32.46
- Simple MA 20: 32.67
- Simple MA 50: 31.80
Indicators:
- RSI: 43.82 (Neutral)
- Stochastic Oscillator: 24.7 (Sell Zone)
Key Levels:
- Resistance: R1 32.33 | R2 33.24
- Support: S1 31.61 | S2 30.88
Overall Sentiment: Neutral
Market Direction: Sell
Trade Suggestion:
- Entry: 32.17
- Take Profit: 31.53
- Stop Loss: 32.64
CRUDE OIL (WTI)
Crude Oil Slides Toward $60.50 as Supply Concerns Weigh on Sentiment
Crude oil prices have fallen sharply in both New York and London trading hours. U.S. President Trump’s comments about nearing a deal with Iran have sharply shifted sentiment, putting downward pressure on prices. U.S. stockpile data showing a significant build further adds bearish momentum.
For UK and U.S. energy traders, supply-side headlines and OPEC forecasts remain crucial in shaping short-term positions.
Technical Overview
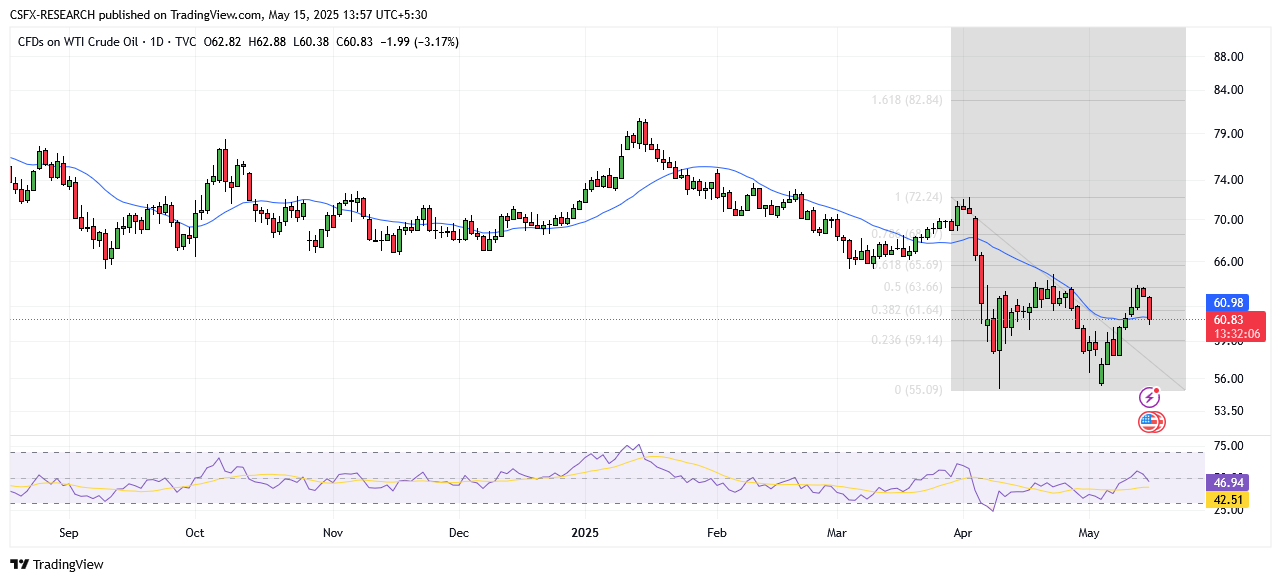
Moving Averages:
- Exponential MA 10: 61.20
- Exponential MA 20: 61.43
- Exponential MA 50: 63.78
- Simple MA 10: 60.34 (Bullish crossover)
- Simple MA 20: 61.10
- Simple MA 50: 64.12
Indicators:
- RSI: 46.05 (Neutral)
- Stochastic Oscillator: 84.25 (Neutral)
Key Levels:
- Resistance: R1 68.40 | R2 72.45
- Support: S1 55.30 | S2 51.25
Overall Sentiment: Neutral
Market Direction: Buy
Trade Suggestion:
- Entry: 50.80
- Take Profit: 62.70
- Stop Loss: 58.05
NATURAL GAS
Natural Gas Holds Key Support, Eyes Rebound Above $3.59
Natural gas futures remain resilient above $3.423, despite failing to reclaim the $3.594 level decisively. This area is pivotal for UK and U.S. traders, especially given its technical significance as a demand zone. A reclaim could invite fresh upside momentum during U.S. trading hours.
Technical Overview
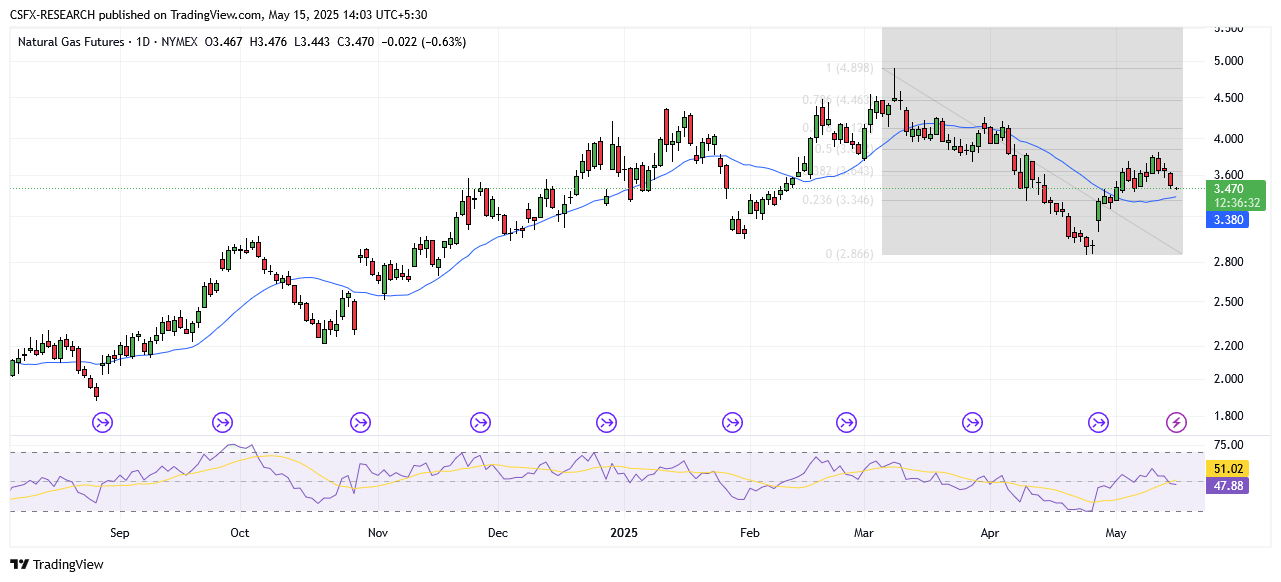
Moving Averages:
- Exponential MA 10: 3.4731
- Exponential MA 20: 3.4625
- Exponential MA 50: 3.5739
- Simple MA 10: 3.5222
- Simple MA 20: 3.3364 (Bullish crossover)
- Simple MA 50: 3.6918
Indicators:
- RSI: 46.91 (Neutral)
- Stochastic Oscillator: 63.52 (Buy Zone)
Key Levels:
- Resistance: R1 3.9384 | R2 4.2443
- Support: S1 2.9483 | S2 2.6424
Overall Sentiment: Bearish
Market Direction: Sell
Trade Suggestion:
- Entry: 3.55
- Take Profit: 3.36
- Stop Loss: 3.72
Commodity Snapshot (As of London Midday)
- Gold: Down 0.74% at 3152.76
- Silver: Down 0.9% at 31.91
- Palladium: Down 0.03% at 952.14
- Platinum: Up 0.96% at 997.54
- Brent Crude: Down 2.78% at 63.94
- WTI Crude: Down 3.02% at 60.97
Key Economic Events (Local Times)
UK Economic Data (London Time):
- 11:30 – GDP (MoM, Mar): Forecast 0.0%, Previous 0.5%
- 11:30 – GDP (QoQ, Q1): Forecast 0.6%, Previous 0.1%
- 11:30 – GDP (YoY, Q1): Forecast 1.2%, Previous 1.5%
U.S. Economic Data (New York Time):
- 08:30 – Core Retail Sales (MoM, Apr): Forecast 0.3%, Previous 0.5%
- 08:30 – Initial Jobless Claims: Forecast 229K, Previous 228K
Questions & Answers
1. Why is gold still bearish despite a weaker U.S. Dollar?
The decline in recession fears and easing Fed rate cut expectations support the dollar’s outlook long-term, even if it’s temporarily weaker—limiting gold’s upside.
2. Is silver likely to fall below $31.00 soon?
If current support at $31.61 fails, silver could test $30.88 or even deeper levels, especially if momentum remains bearish and macro risk appetite improves.
3. What’s pushing crude oil prices lower despite Middle East tensions?
Fresh hopes of a U.S.-Iran nuclear deal and larger-than-expected U.S. crude inventories are outweighing geopolitical concerns, shifting sentiment bearish.
4. Is natural gas expected to rebound soon?
If prices reclaim $3.594 and hold above the $3.423 support, a short-term bullish reversal could unfold, particularly in the New York trading session.
5. How should UK and U.S. traders prepare for today’s key economic data?
Traders should watch the 11:30 (London) UK GDP data for domestic cues, and U.S. traders should monitor 08:30 (New York) for PPI and jobless claims—key inputs for Fed and BoE rate path expectations.