KEY HIGHLIGHTS
- Gold Climbs Above $2,630 Amid Geopolitical Risks, Limited Gains.
- Silver Struggles Below $30 Despite Weak US Data.
- WTI Oil Gains Slightly, Awaits Stronger Bullish Momentum.
- Natural Gas Soars on Colder Weather, LNG Demand Surge.
INTRODUCTION
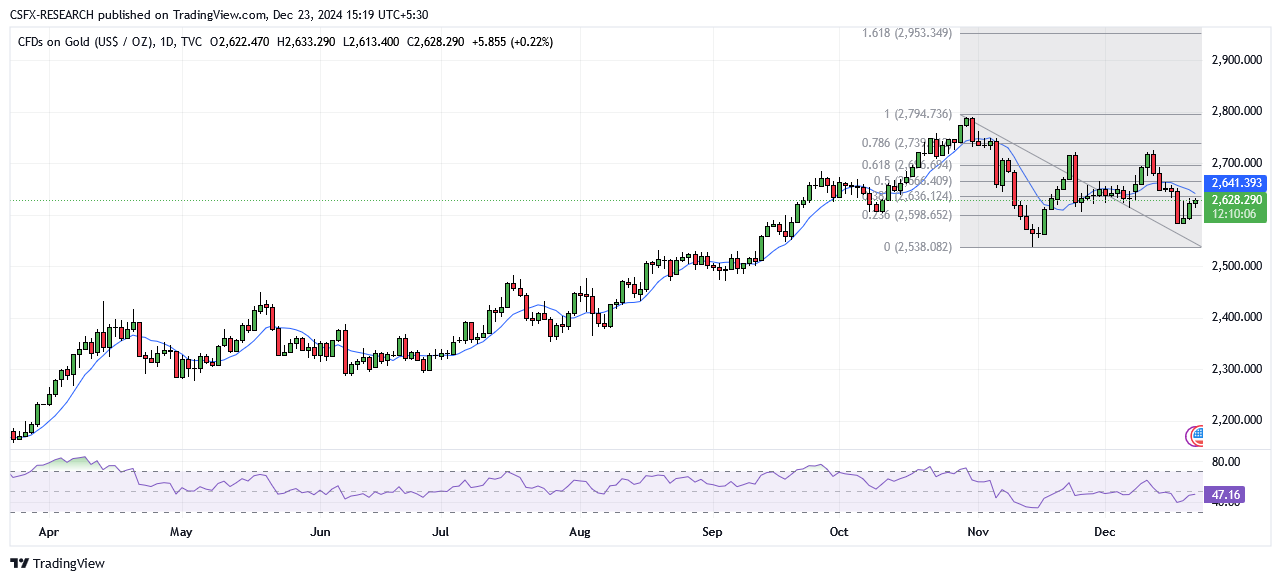
Gold prices advanced to a three-day high above $2,630, fueled by safe-haven demand amid escalating geopolitical risks. Despite this recovery, bullish momentum remains limited due to counterbalancing factors such as elevated U.S. Treasury yields and a robust U.S. Dollar. Traders are closely monitoring the Conference Board’s Consumer Confidence Index for additional market direction.
Technical Overview

- Moving Averages (Exponential):
- MA 10: $2,632.68 | Negative Crossover | Bearish
- MA 20: $2,641.29 | Negative Crossover | Bearish
- MA 50: $2,640.75 | Negative Crossover | Bearish
- Moving Averages (Simple):
- MA 10: $2,646.76 | Negative Crossover | Bearish
- MA 20: $2,643.95 | Negative Crossover | Bearish
- MA 50: $2,668.48 | Negative Crossover | Bearish
- Indicators:
- RSI: 47.13 | Buy Zone | Bullish
- Stochastic Oscillator: 22.31 | Sell Zone | Neutral
- Resistance and Support Levels:
- R1: $2,735.87 | R2: $2,789.05
- S1: $2,563.71 | S2: $2,510.53
Market Sentiment: Bearish Trade Suggestion:
- Limit Sell: $2,632.57
- Take Profit: $2,603.68
- Stop Loss: $2,652.05
Silver Struggles Below $30.00
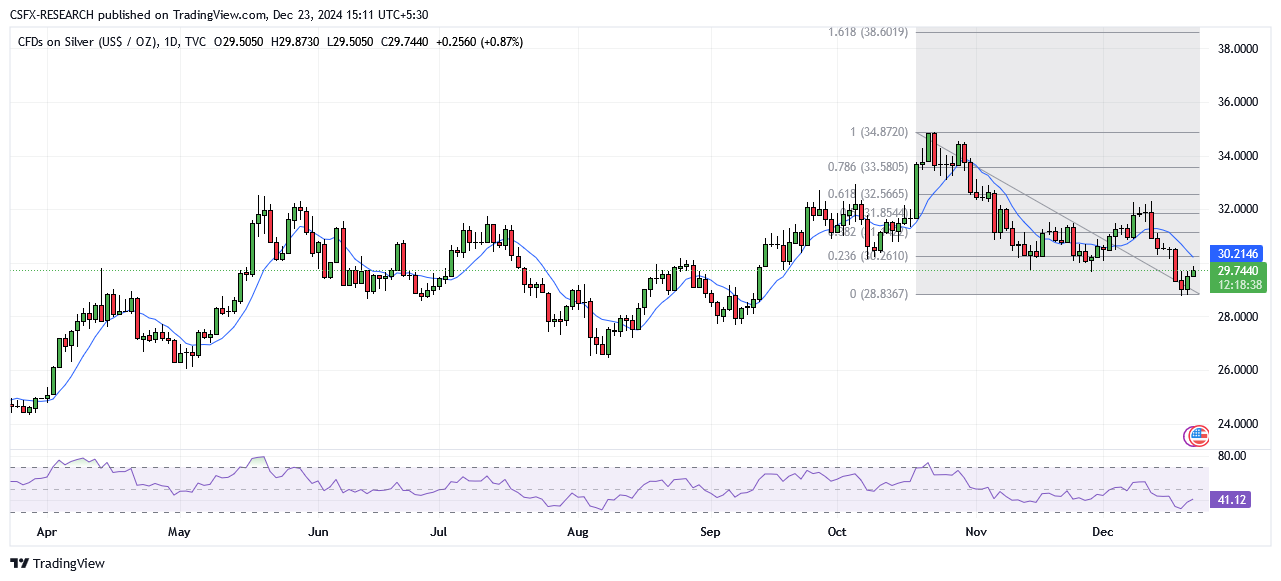
Silver (XAG/USD) remains under bearish pressure, trading around $29.60. Weak U.S. inflation data supports the recovery, but the Federal Reserve’s cautious stance on monetary easing caps further gains. Key support lies at $29.10-$29.00, with a potential downside to $27.70 if breached. Resistance at $30.00 must be surpassed for significant upward movement.
Technical Overview

- Moving Averages (Exponential):
- MA 10: $30.34 | Negative Crossover | Bearish
- MA 20: $30.59 | Negative Crossover | Bearish
- MA 50: $31.20 | Negative Crossover | Bearish
- Moving Averages (Simple):
- MA 10: $30.06 | Negative Crossover | Bearish
- MA 20: $30.43 | Negative Crossover | Bearish
- MA 50: $30.86 | Negative Crossover | Bearish
- Indicators:
- RSI: 40.05 | Neutral Zone
- Stochastic Oscillator: 18.07 | Sell Zone | Neutral
- Resistance and Support Levels:
- R1: $30.67 | R2: $31.75
- S1: $29.84 | S2: $28.63
Market Sentiment: Bearish Trade Suggestion:
- Limit Sell: $29.90
- Take Profit: $28.85
- Stop Loss: $30.64
WTI Oil Edges Higher
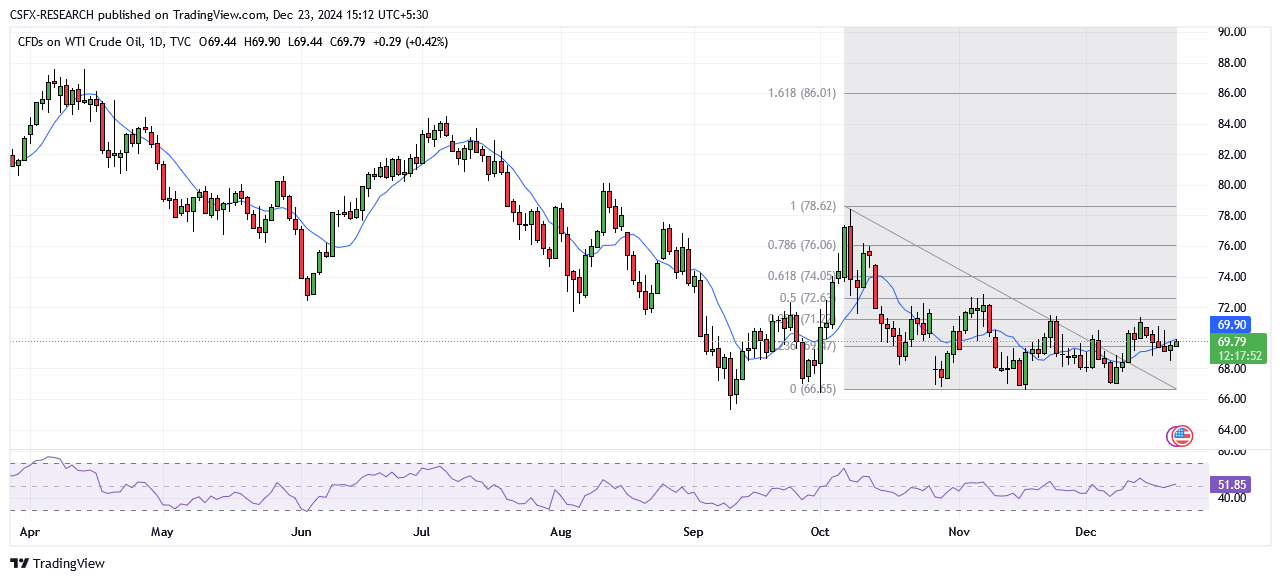
WTI crude oil prices advanced slightly to $69.75, recovering from a one-week low. Supportive factors include optimism surrounding China’s property market recovery and potential supply disruptions from sanctions on Russia and Iran. Despite the upward trend, strong follow-through buying is needed for sustained gains. Market participants are awaiting the Consumer Confidence Index for further cues.
Technical Overview

- Moving Averages (Exponential):
- MA 10: $69.68 | Positive Crossover | Bullish
- MA 20: $69.54 | Positive Crossover | Bullish
- MA 50: $69.99 | Negative Crossover | Bearish
- Moving Averages (Simple):
- MA 10: $69.93 | Negative Crossover | Bearish
- MA 20: $69.23 | Positive Crossover | Bullish
- MA 50: $69.62 | Positive Crossover | Bullish
- Indicators:
- RSI: 51.12 | Buy Zone | Bullish
- Stochastic Oscillator: 57.23 | Neutral Zone
- Resistance and Support Levels:
- R1: $71.59 | R2: $73.07
- S1: $66.80 | S2: $65.32
Market Sentiment: Neutral Trade Suggestion:
- Limit Sell: $70.11
- Take Profit: $68.88
- Stop Loss: $70.55
Natural Gas Surges on Strong LNG Demand
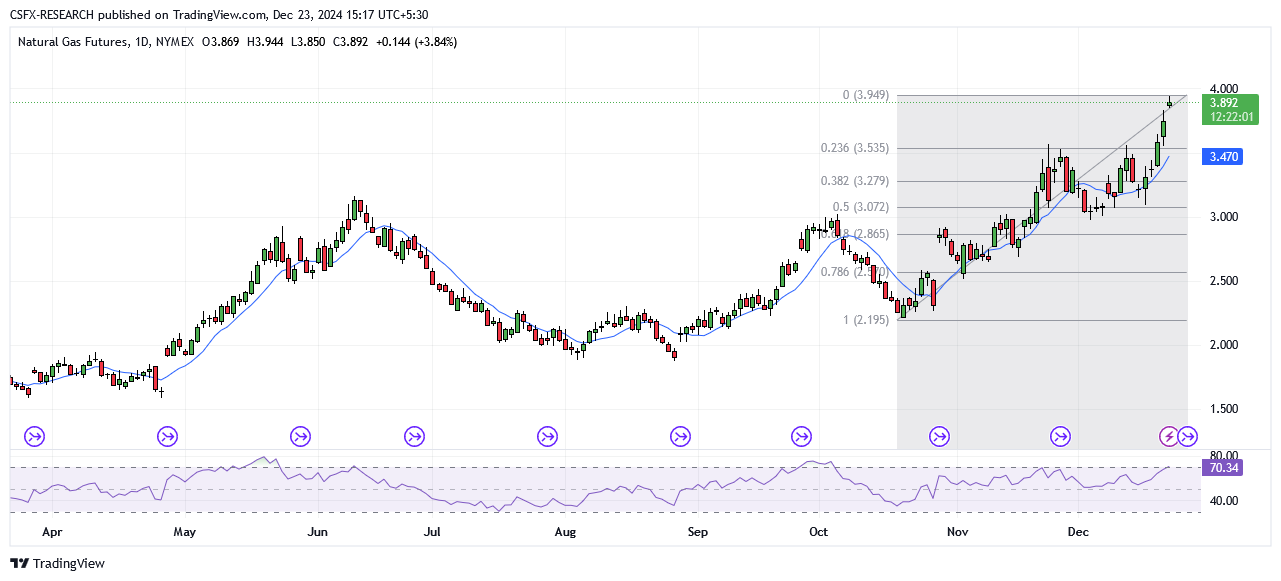
Natural gas prices soared 7.02%, driven by increased global LNG demand and colder weather forecasts in the U.S. Projections of a significant withdrawal season and geopolitical factors limiting Russian gas supply to Europe have added upward pressure. Technically, natural gas remains in a bullish phase, supported by strong short-covering.
Technical Overview

- Moving Averages (Exponential):
- MA 10: $3.29 | Positive Crossover | Bullish
- MA 20: $3.15 | Positive Crossover | Bullish
- MA 50: $2.89 | Positive Crossover | Bullish
- Moving Averages (Simple):
- MA 10: $3.27 | Positive Crossover | Bullish
- MA 20: $3.13 | Positive Crossover | Bullish
- MA 50: $2.79 | Positive Crossover | Bullish
- Indicators:
- RSI: 69.78 | Buy Zone | Bullish
- Stochastic Oscillator: 94.76 | Buy Zone
- Resistance and Support Levels:
- R1: $3.29 | R2: $3.56
- S1: $2.39 | S2: $2.12
Market Sentiment: Bullish Trade Suggestion:
- Limit Buy: $3.70
- Take Profit: $3.94
- Stop Loss: $3.57
Broader Commodity Market Highlights
- Gold: Up 0.19% at $2,627.33
- Silver: Up 0.74% at $29.70
- Palladium: Up 0.16% at $920.30
- Platinum: Up 1.56% at $938.43
- Brent Crude Oil: Down 0.05% at $72.91
- WTI Crude Oil: Down 0.03% at $69.48
Key Economic Events Today
- GBP GDP (YoY) (Q3): Forecast 0.2%, Previous 1.0%
- GBP GDP (QoQ) (Q3): Forecast 0.1%, Previous 0.4%
- USD CB Consumer Confidence (Dec): Forecast 112.9, Previous 111.7

