
Mixed signals continue to shape commodity markets as investors monitor critical developments, including a potential US-UK trade deal, upcoming US jobless claims data, and ongoing US-China trade negotiations. Central bank policies and global economic sentiment remain key drivers of price action across gold, silver, oil, and natural gas markets.
KEY HIGHLIGHTS
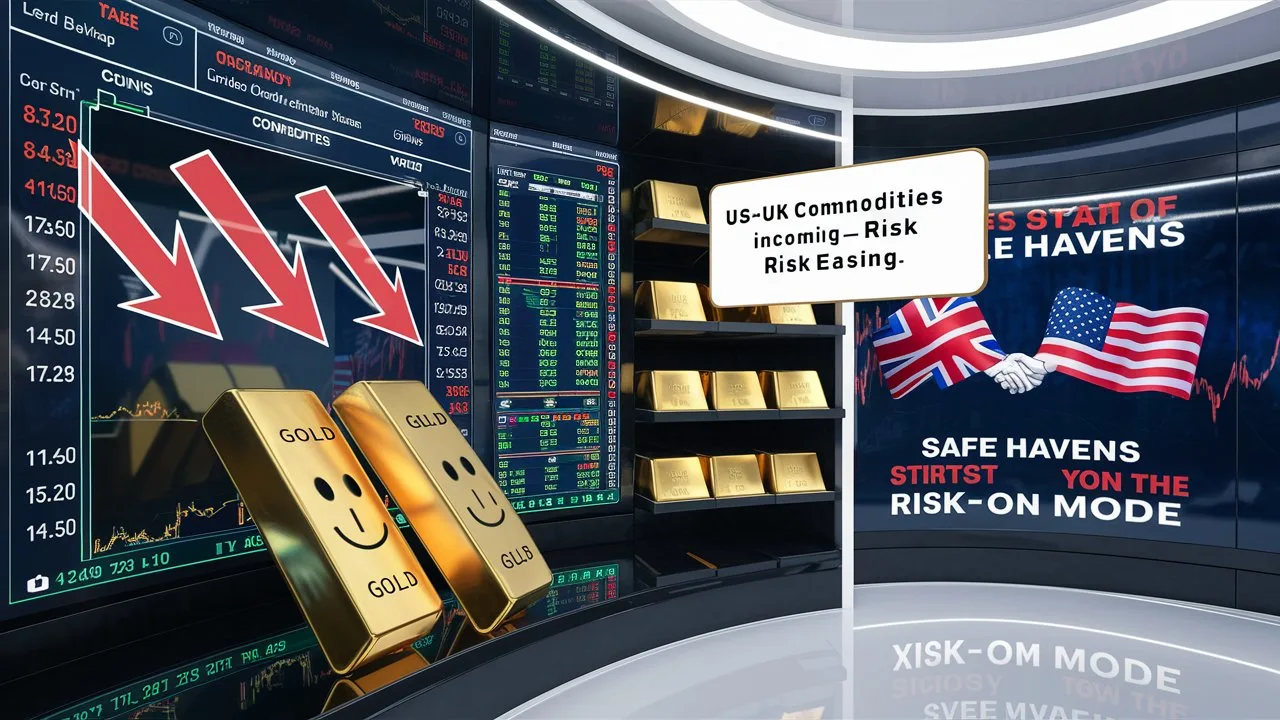
- Gold Drops Ahead of Expected US-UK Trade Deal Announcement
- Silver Faces Pressure as Key Support Level Approaches Again
- Crude Oil Rises Slightly on Inventory Drop, Trade Uncertainty
- Natural Gas Eyes Breakout If Resistance at $3.721 Holds Firm
Gold (XAU/USD)
Gold Declines Amid Risk-On Sentiment and Trade Deal Optimism
Gold prices fell for the second consecutive session on Thursday, pressured by improved market sentiment and optimism surrounding a possible US-UK trade agreement. The metal dropped nearly 1%, trading around $3,333.
Key Drivers:
- US-UK Trade Deal: US President Trump is expected to announce a trade deal with the UK at 14:00 GMT. UK officials have confirmed the announcement but withheld specific details.
- Federal Reserve Policy: The Fed held rates at 4.25%–4.50%. Chair Powell highlighted economic resilience but warned of risks from tariffs and global uncertainty.
- Market Expectations: FedWatch Tool suggests no rate cuts before summer, reinforcing a cautious outlook.
Technical Overview:

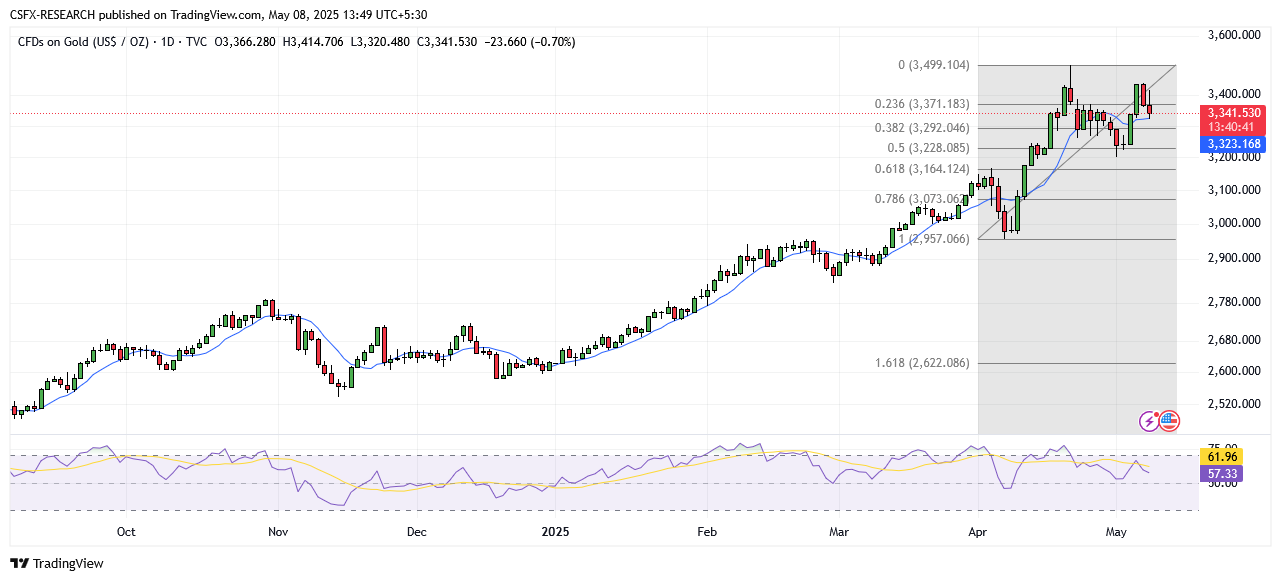
Moving Averages (Exponential):
- MA 10: 3327.76 – Bullish
- MA 20: 3283.68 – Bullish
- MA 50: 3151.89 – Bullish
Moving Averages (Simple):
- MA 10: 3321.61 – Bullish
- MA 20: 3308.75 – Bullish
- MA 50: 3121.57 – Bullish
Indicators:
- RSI: 57.47 – Buy Zone, Bullish
- Stochastic Oscillator: 59.31 – Neutral
Key Levels:
- Resistance: R1: 3455.95 | R2: 3584.20
- Support: S1: 3040.74 | S2: 2912.49
Market Sentiment: Bullish
Trade Suggestion:
- Limit Buy: 3333.00
- Take Profit: 3369.50
- Stop Loss: 3315.20
Silver (XAG/USD)
Silver Under Pressure Below Key Resistance
Silver prices remain below the $32.835 resistance level, trading around $32.36 after reaching a peak of $32.94. Despite support from a weaker USD, silver could face further downside if it breaks the $32.232 support.
Key Drivers:
- Dual Demand Nature: Silver benefits from both industrial demand and safe-haven appeal.
- US Dollar Weakness: The Dollar Index (DXY) remains below 101, supporting silver.
- Upcoming Data: US jobless claims data could influence near-term direction.
Technical Overview:
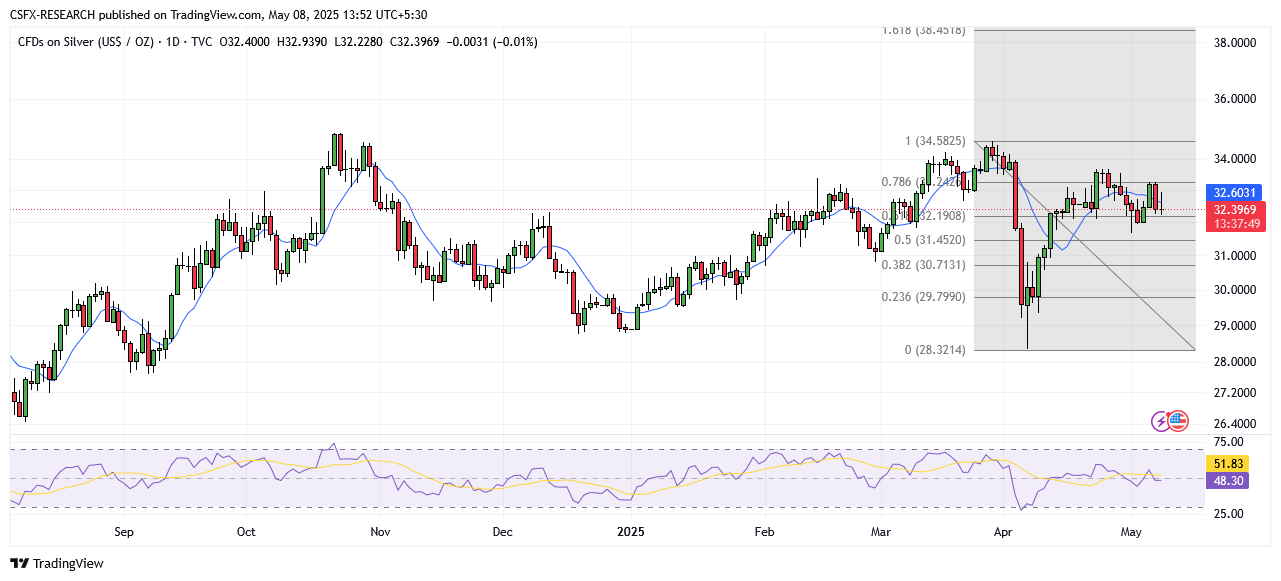
Moving Averages (Exponential):
- MA 10: 32.64 – Bearish
- MA 20: 32.59 – Bearish
- MA 50: 31.70 – Bullish
Moving Averages (Simple):
- MA 10: 32.58 – Bearish
- MA 20: 32.57 – Bearish
- MA 50: 48.22 – Bullish
Indicators:
- RSI: 48.43 – Neutral
- Stochastic Oscillator: 44.48 – Neutral
Key Levels:
- Resistance: R1: 33.35 | R2: 34.42
- Support: S1: 32.22 | S2: 31.57
Market Sentiment: Neutral
Market Direction: Sell
Trade Suggestion:
- Limit Sell: 32.58
- Take Profit: 32.15
- Stop Loss: 32.84
Crude Oil (WTI)
WTI Rises but Faces Headwinds from Trade Uncertainty
WTI crude oil rebounded above $58.00 in Asian trading, supported by a drop in US inventories. However, ongoing US-China trade tensions continue to cap upside potential.
Key Drivers:
- EIA Report: US crude inventories fell by 2.032 million barrels.
- US-China Negotiations: Scheduled talks on May 10 in Switzerland aim to restart dialogue, though expectations remain low.
- Federal Reserve Outlook: Powell emphasized uncertainty due to tariffs, maintaining a cautious policy stance.
Technical Overview:
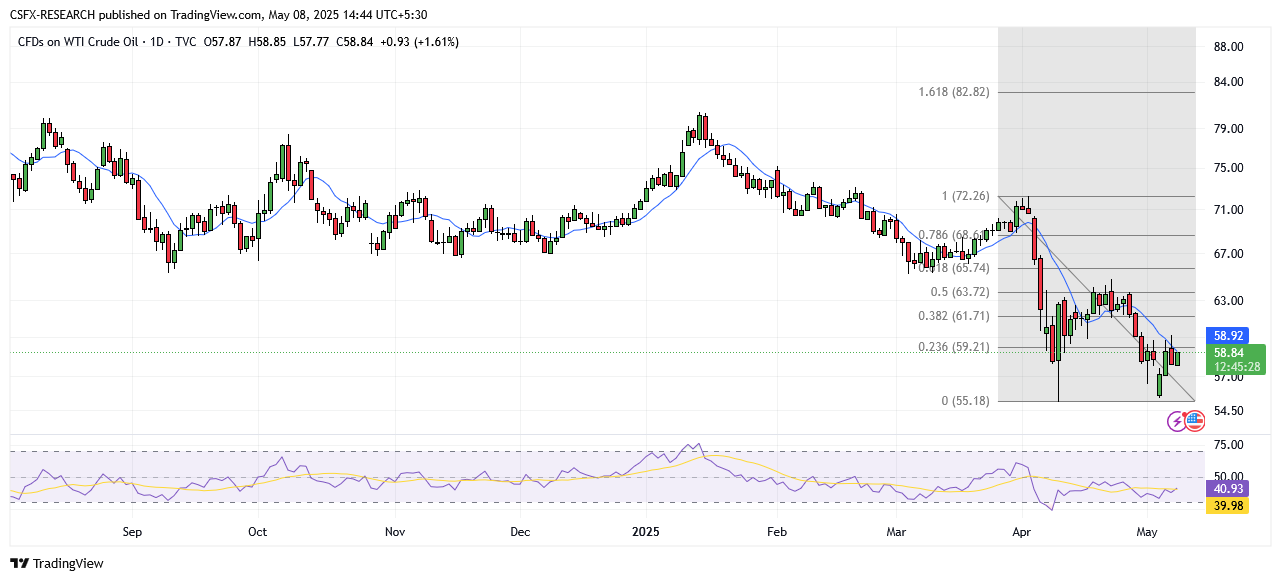
Moving Averages (Exponential):
- MA 10: 59.35 – Bearish
- MA 20: 60.85 – Bearish
- MA 50: 64.10 – Bearish
Moving Averages (Simple):
- MA 10: 59.37 – Bearish
- MA 20: 60.87 – Bearish
- MA 50: 64.74 – Bearish
Indicators:
- RSI: 40.49 – Neutral
- Stochastic Oscillator: 34.45 – Neutral
Key Levels:
- Resistance: R1: 68.40 | R2: 72.45
- Support: S1: 55.30 | S2: 51.25
Market Sentiment: Bearish
Market Direction: Sell
Trade Suggestion:
- Limit Sell: 59.14
- Take Profit: 57.42
- Stop Loss: 60.25
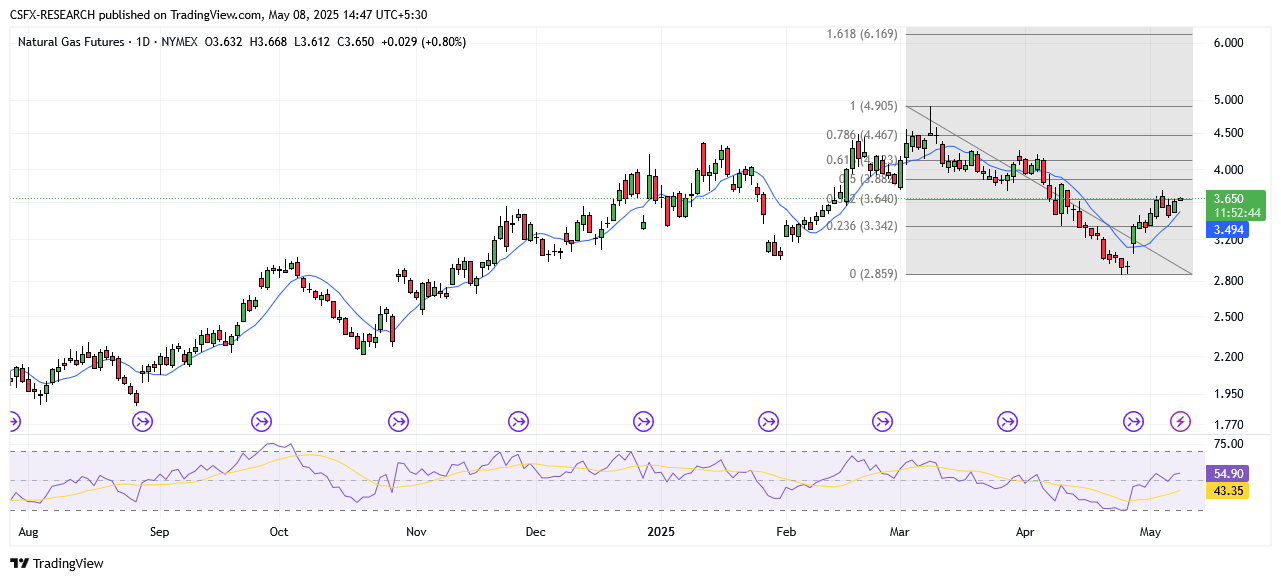
Natural Gas
Natural Gas Eyes Breakout Above Key Resistance
Natural gas is trading near $3.637, supported by a rising trendline and a strong technical foundation. A break above $3.721 could signal a move toward $3.864.
Key Drivers:
- Technical Support: 50-day EMA at $3.503 underpins the recent recovery.
- Trend Momentum: Holding above $3.452 and near $3.721 signals strength.
- Market Focus: A sustained breakout could attract additional buyers.
Technical Overview:
Moving Averages (Exponential):
- MA 10: 3.412 – Bullish
- MA 20: 3.423 – Bullish
- MA 50: 3.583 – Bearish
Moving Averages (Simple):
- MA 10: 3.365 – Bullish
- MA 20: 3.300 – Bullish
- MA 50: 3.762 – Bearish
Indicators:
- RSI: 53.57 – Bullish
- Stochastic Oscillator: 80.57 – Neutral
Key Levels:
- Resistance: R1: 3.938 | R2: 4.244
- Support: S1: 2.948 | S2: 2.642
Market Sentiment: Bullish
Market Direction: Buy
Trade Suggestion:
- Limit Buy: 3.54
- Take Profit: 3.83
- Stop Loss: 3.39
Commodity Market Summary
- Gold: Down 0.73% at $3,340.55
- Silver: Down 0.50% at $32.38
- Palladium: Down 0.58% at $957.42
- Platinum: Up 0.11% at $977.42
- Brent Crude Oil: Up 1.10% at $61.64
- WTI Crude Oil: Up 1.26% at $58.65
Key Economic Events Today
- BoE Interest Rate Decision (GBP):
- Forecast: 4.25%
- Previous: 4.50%
- Time: 16:30 GMT
- US Initial Jobless Claims (USD):
- Forecast: 231K
- Previous: 241K
- Time: 18:00 GMT