
The commodities market experienced notable price fluctuations this week. Gold surged to fresh all-time highs amid trade war concerns, while Silver maintained its strength on inflation expectations. Oil posted a third consecutive weekly gain despite global recession fears, and Natural Gas extended its rally but struggled with overhead resistance. As traders look ahead, key economic data releases, trade developments, and Federal Reserve signals will be closely monitored for further market direction.
KEY HIGHLIGHTS
- EUR/USD Eyes Further Gains Amid US Dollar Weakness.
- GBP/USD Consolidates Below 1.3000 Before Tariff Impact.
- USD/JPY Awaits Key US Data for Direction.
- AUD/USD Faces Pressure from Fed, China Uncertainty.
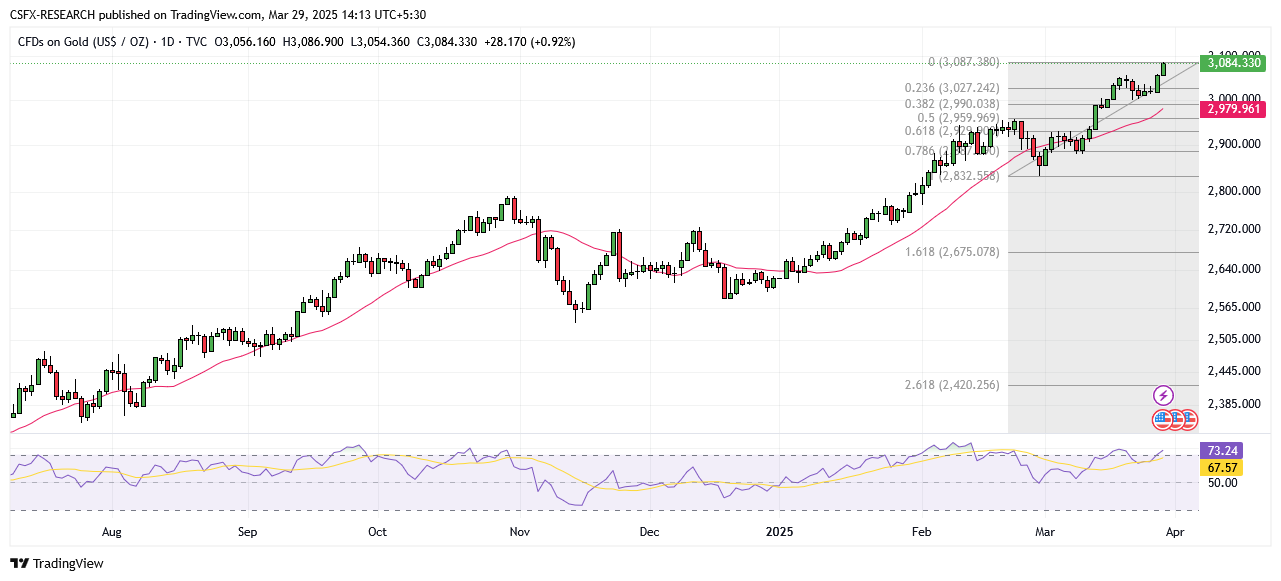
Gold Weekly Outlook: Trade War Concerns Drive Gold to Fresh Record Highs
Gold (XAU/USD) soared to a new record high above $3,080 on Friday, gaining strong bullish momentum after a range-bound start to the week. The US government’s announcement of reciprocal tariffs and upcoming economic data releases could determine Gold’s near-term trajectory.
Market Insights
- Early in the week, Gold remained stable above $3,000, lacking major catalysts.
- On Thursday, safe-haven demand strengthened in the Asian session, reigniting bullish momentum.
- Risk aversion persisted into Friday, pushing Gold past $3,080.
- Key upcoming events: Tuesday’s ISM Manufacturing PMI, JOLTS Job Openings, and Friday’s Non-Farm Payrolls (NFP). A stronger US Dollar could pressure XAU/USD if NFP data exceeds 200,000.
Technical Analysis

Moving Averages
Exponential:
- MA 10: 3027.42 | Bullish
- MA 20: 2991.92 | Bullish
- MA 50: 2907.83 | Bullish
Simple:
- MA 10: 3033.87 | Bullish
- MA 20: 2979.82 | Bullish
- MA 50: 2901.94 | Bullish
Indicators
- RSI: 73.49 | Buy Zone | Bullish
- Stochastic Oscillator: 91.57 | Neutral
- Resistance & Support Levels
- Resistance: R1: 2932.05, R2: 2975.46
- Support: S1: 2791.51, S2: 2748.10
Trade Suggestion
- Limit Buy: 3057.65
- Take Profit: 3086.00
- Stop Loss: 3042.20
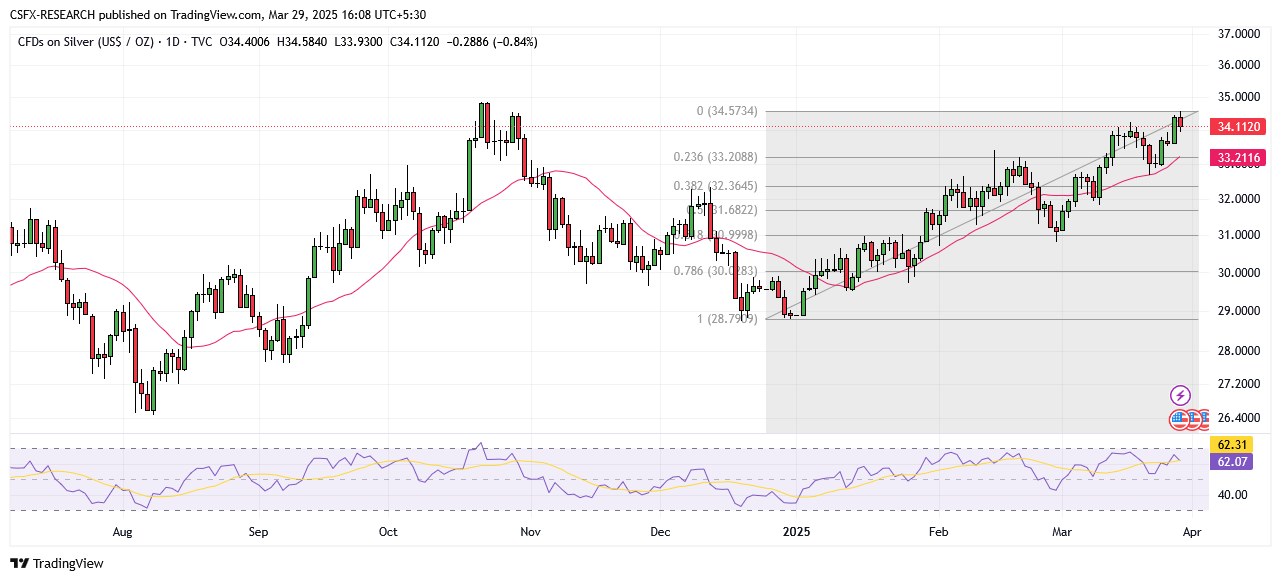
Silver Weekly Outlook: Bulls Maintain Strength Amid Trade Uncertainty & Fed Cues
Silver (XAG/USD) remains a key focus in the commodities market, driven by inflation concerns and evolving Federal Reserve expectations. President Trump’s reciprocal tariffs, set to take effect on April 2, could push import costs higher, reinforcing Silver’s bullish bias.
Market Insights
- Key support levels: $32.66, $32.30, and $31.81.
- Silver traders should monitor ISM Manufacturing and Services PMIs, employment reports, and tariff updates.
- A stronger US Dollar could cap gains, but safe-haven demand may sustain Silver’s momentum.
Technical Analysis
Moving Averages
Exponential:
- MA 10: 33.65 | Bullish
- MA 20: 33.25 | Bullish
- MA 50: 31.17 | Bullish
Simple:
- MA 10: 33.68 | Bullish
- MA 20: 33.17 | Bearish
- MA 50: 31.20 | Bullish
Indicators
- RSI: 62.13 | Buy Zone | Bullish
- Stochastic Oscillator: 65.03 | Neutral
- Resistance & Support Levels
- Resistance: R1: 34.37, R2: 34.82
- Support: S1: 33.95, S2: 33.49
Trade Suggestion
- Limit Buy: 33.95
- Take Profit: 34.54
- Stop Loss: 33.62
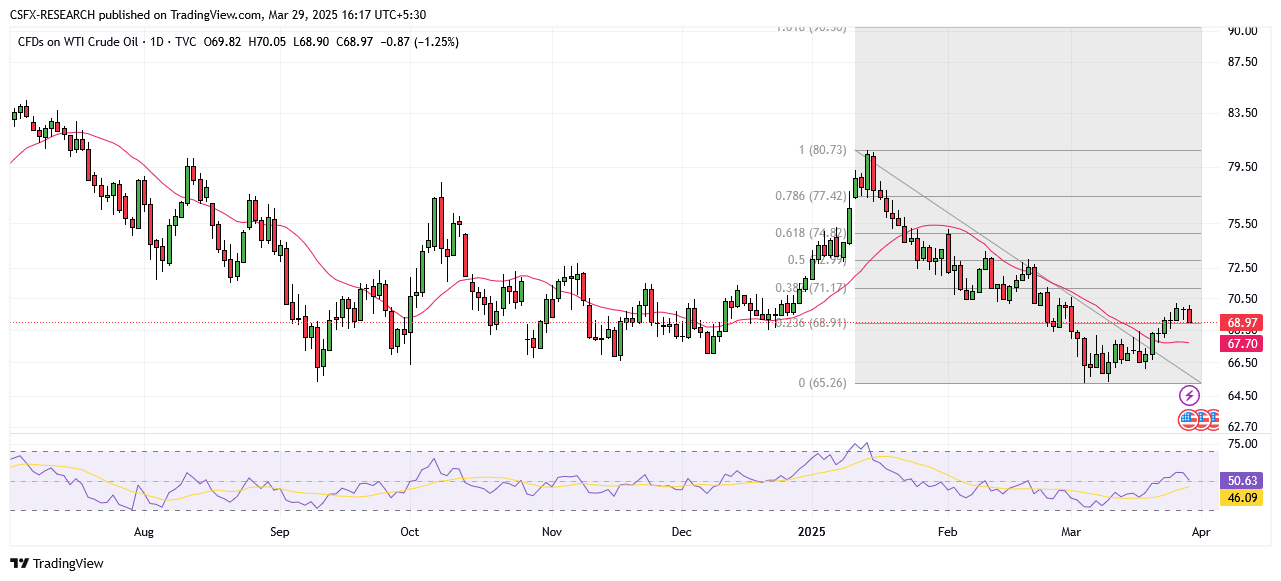
Crude Oil Weekly Outlook: Oil Gains for Third Week Despite Recession Fears
Oil prices dipped on Friday over concerns that US tariff disputes might trigger a global recession. However, crude still secured a third consecutive weekly gain, driven by rising geopolitical tensions and OPEC+ policies.
Market Insights
- Weekly Performance: Brent crude rose 1.9%, WTI gained 1.6%.
- Since early March, Brent has climbed 7%, WTI up 6%.
- Supply risks from Middle East conflicts and US sanctions on Venezuela/Iran remain key bullish drivers.
- Traders will focus on US inventory data, China’s economy, and Federal Reserve policies.
Technical Analysis
Moving Averages
Exponential:
- MA 10: 68.79 | Bullish
- MA 20: 68.69 | Bullish
- MA 50: 69.75 | Bearish
Simple:
- MA 10: 68.53 | Bullish
- MA 20: 67.77 | Bullish
- MA 50: 70.46 | Bearish
Indicators
- RSI: 50.93 | Bullish
- Stochastic Oscillator: 88.76 | Neutral
- Resistance & Support Levels
- Resistance: R1: 73.75, R2: 75.35
- Support: S1: 68.54, S2: 66.94
Trade Suggestion
- Limit Buy: 68.39
- Take Profit: 70.17
- Stop Loss: 67.47
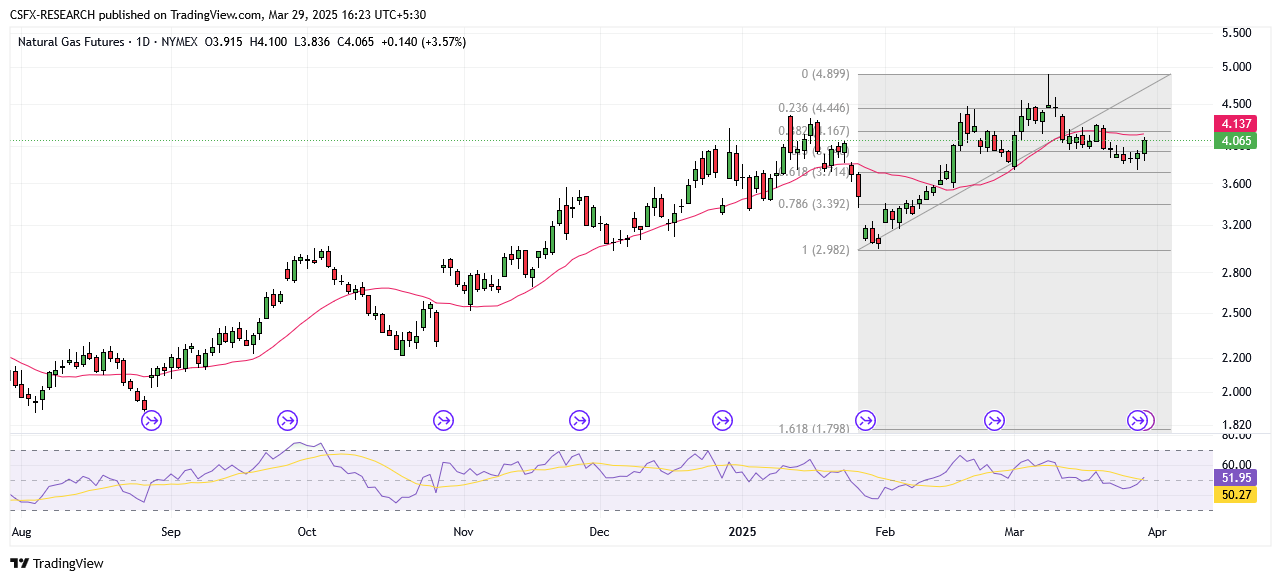
Natural Gas Weekly Outlook: Overhead Resistance Limits Upside Potential
Natural Gas extended its rally on Friday, reaching a six-day high of $4.08. However, persistent resistance and oversupply concerns continue to limit sustained upside potential.
Market Insights
- Key breakout: Cleared 50-day moving average on Thursday.
- Support Level: $3.72 (aligned with the 61.8% Fibonacci retracement level).
- Headwinds: Oversupply, mild weather forecasts, and high storage levels.
Technical Analysis
Moving Averages
Exponential:
- MA 10: 4.01 | Bullish
- MA 20: 4.06 | Bullish
- MA 50: 3.94 | Bullish
Simple:
- MA 10: 4.00 | Bullish
- MA 20: 4.17 | Bearish
- MA 50: 3.96 | Bullish
Indicators
- RSI: 50.80 | Bullish
- Stochastic Oscillator: 18.49 | Neutral
- Resistance & Support Levels
- Resistance: R1: 4.36, R2: 4.62
- Support: S1: 3.52, S2: 3.27
Trade Suggestion
- Limit Buy: 3.95
- Take Profit: 4.25
- Stop Loss: 3.79
Key Economic Events & Data Releases
- Monday: CNY Manufacturing PMI, EUR German CPI.
- Tuesday: AUD RBA Interest Rate Decision, EUR CPI YoY, USD ISM Manufacturing PMI, USD JOLTS Job Openings.
- Friday: USD Nonfarm Payrolls, Unemployment Rate, Fed Chair Powell Speech.