

Markets are exhibiting cautious momentum as investors await the outcome of the upcoming Federal Reserve policy meeting. Gold maintains a firm tone, supported by geopolitical tensions and a weaker US Dollar. Silver stabilizes following recent losses, while oil prices dip as OPEC+ accelerates production hikes. Meanwhile, natural gas shows strong bullish momentum, indicating the potential for further gains.
KEY HIGHLIGHTS
- Gold stays firm ahead of Fed meeting, eyes dollar weakness.
- Silver steadies near $32 amid rising safe-haven asset demand.
- Crude dips as OPEC+ ramps up June production hike.
- Natural gas breaks higher, targets $4 amid bullish momentum.
Gold (XAU/USD)
Fundamental Overview
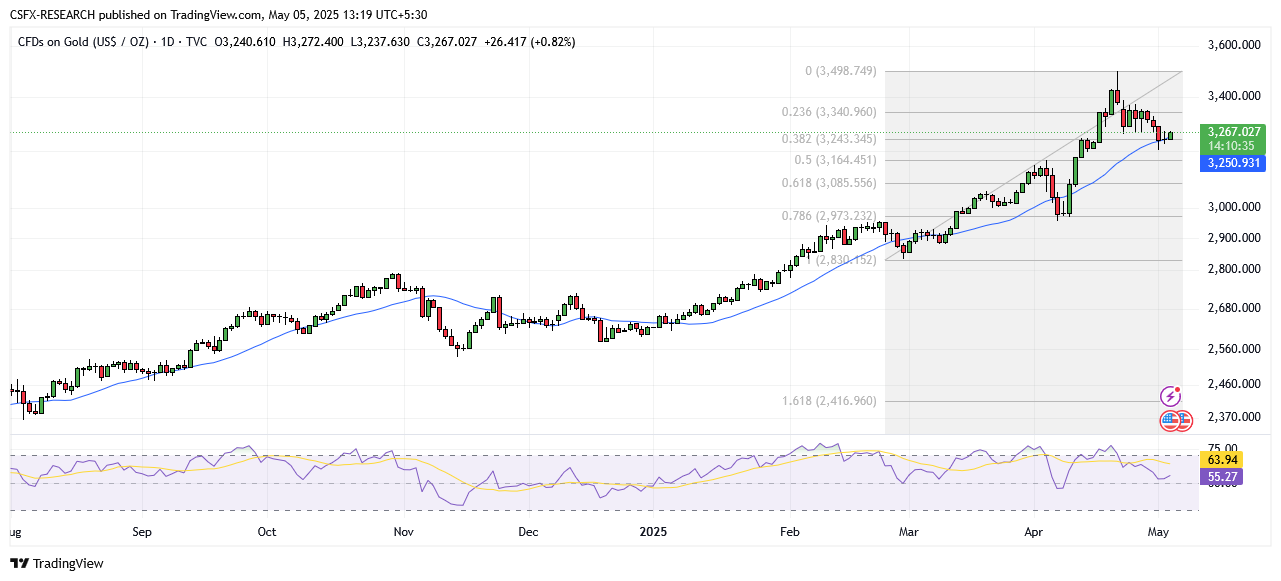
Gold prices remain steady during the European session, trading within a positive range but lacking clear direction. Investor sentiment remains cautious as the market anticipates the outcome of the Federal Reserve’s two-day FOMC meeting, which is expected to heavily influence the US Dollar and gold’s near-term trajectory.
Key Supportive Factors:
- Geopolitical tensions, including the ongoing Russia-Ukraine war and instability in the Middle East.
- Market uncertainty over US policy direction and Fed rate decisions.
- A subdued US Dollar trading below recent highs amid expectations of future rate cuts.
Technical Overview

Moving Averages
Exponential Moving Averages:
- MA 10: 3278.45 | Negative Crossover | Bearish
- MA 20: 3245.12 | Positive Crossover | Bullish
- MA 50: 3120.52 | Positive Crossover | Bullish
Simple Moving Averages:
- MA 10: 3302.98 | Negative Crossover | Bearish
- MA 20: 3250.88 | Positive Crossover | Bullish
- MA 50: 3093.19 | Positive Crossover | Bullish
Indicators
- RSI: 55.25 | Buy Zone | Bullish
- Stochastic Oscillator: 18.83 | Sell Zone | Neutral
Key Levels
- Resistance: R1: 3455.95 | R2: 3584.20
- Support: S1: 3040.74 | S2: 2912.49
Overall Sentiment: Bullish
Market Direction: Buy
Trade Suggestion:
- Entry: Limit Buy at 3233.90
- Target: Take Profit at 3300.00
- Risk: Stop Loss at 3201.16
Silver (XAG/USD)
Fundamental Overview
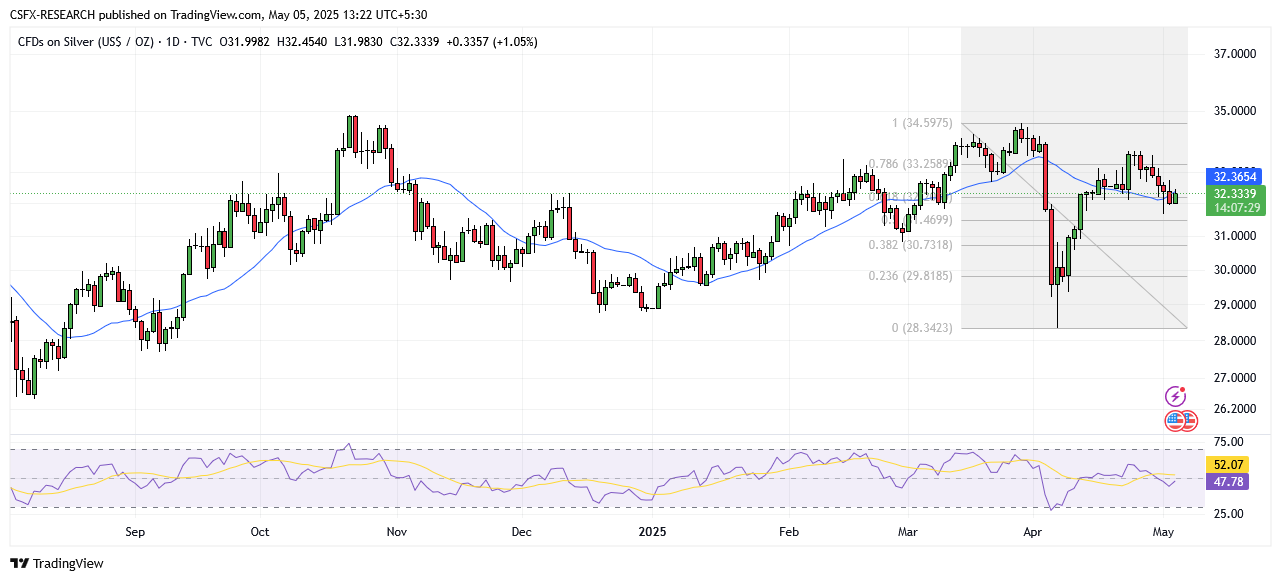
Silver stabilizes around $32.10 after halting a four-day decline, driven by rising safe-haven demand amid global trade uncertainties. Ongoing US-China trade tensions and a weakening US Dollar continue to make Silver attractive to investors.
Key Points:
- US-China trade negotiations remain uncertain.
- The US economy contracted 0.3% in Q1.
- China’s manufacturing PMI fell to a 16-month low.
- Market focus is on the Fed’s policy announcement and US ISM Services PMI.
Technical Overview
Moving Averages
Exponential Moving Averages:
- MA 10: 32.78 | Negative Crossover | Bearish
- MA 20: 32.23 | Positive Crossover | Bullish
- MA 50: 31.60 | Positive Crossover | Bullish
Simple Moving Averages:
- MA 10: 32.53 | Negative Crossover | Bearish
- MA 20: 32.54 | Negative Crossover | Bearish
- MA 50: 31.90 | Positive Crossover | Bullish
Indicators
- RSI: 47.94 | Neutral Zone
- Stochastic Oscillator: 8.29 | Sell Zone
Key Levels
- Resistance: R1: 32.86 | R2: 34.09
- Support: S1: 31.91 | S2: 30.96
Overall Sentiment: Neutral
Market Direction: Sell
Trade Suggestion:
- Entry: Limit Sell at 32.48
- Target: Take Profit at 31.64
- Risk: Stop Loss at 33.16
Crude Oil (WTI)
Fundamental Overview
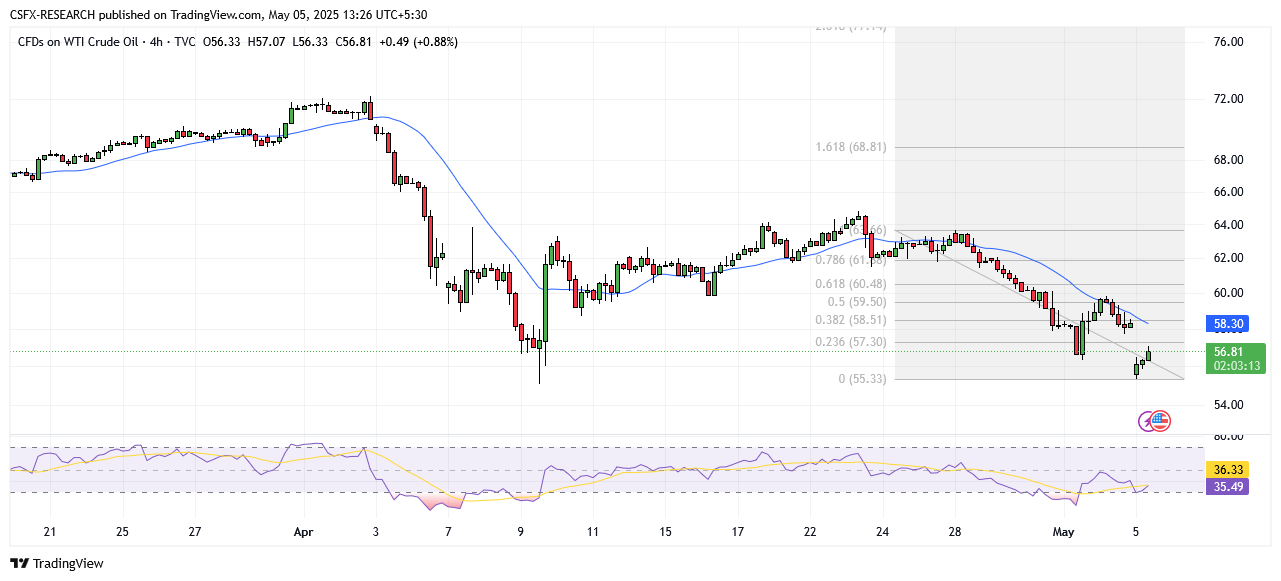
West Texas Intermediate (WTI) oil trades near $56.75 after falling from higher levels, pressured by OPEC+’s decision to boost production by 411,000 barrels per day in June. This follows prior unexpected production increases in April and May.
Key Factors:
- OPEC+ output could add 2.2 million barrels/day by November.
- April saw the largest monthly oil price decline since 2021.
- Recession fears grow due to potential economic slowdowns.
- Middle East geopolitical tensions may provide support.
Technical Overview
Moving Averages
Exponential Moving Averages:
- MA 10: 59.93 | Negative Crossover | Bearish
- MA 20: 61.61 | Negative Crossover | Bearish
- MA 50: 64.79 | Negative Crossover | Bearish
Simple Moving Averages:
- MA 10: 60.61 | Negative Crossover | Bearish
- MA 20: 61.15 | Negative Crossover | Bearish
- MA 50: 65.40 | Negative Crossover | Bearish
Indicators
- RSI: 31.88 | Sell Zone | Bearish
- Stochastic Oscillator: 23.77 | Sell Zone
Key Levels
- Resistance: R1: 68.40 | R2: 72.45
- Support: S1: 55.30 | S2: 51.25
Overall Sentiment: Bearish
Market Direction: Sell
Trade Suggestion:
- Entry: Limit Sell at 57.62
- Target: Take Profit at 55.07
- Risk: Stop Loss at 59.72
Natural Gas
Fundamental Overview
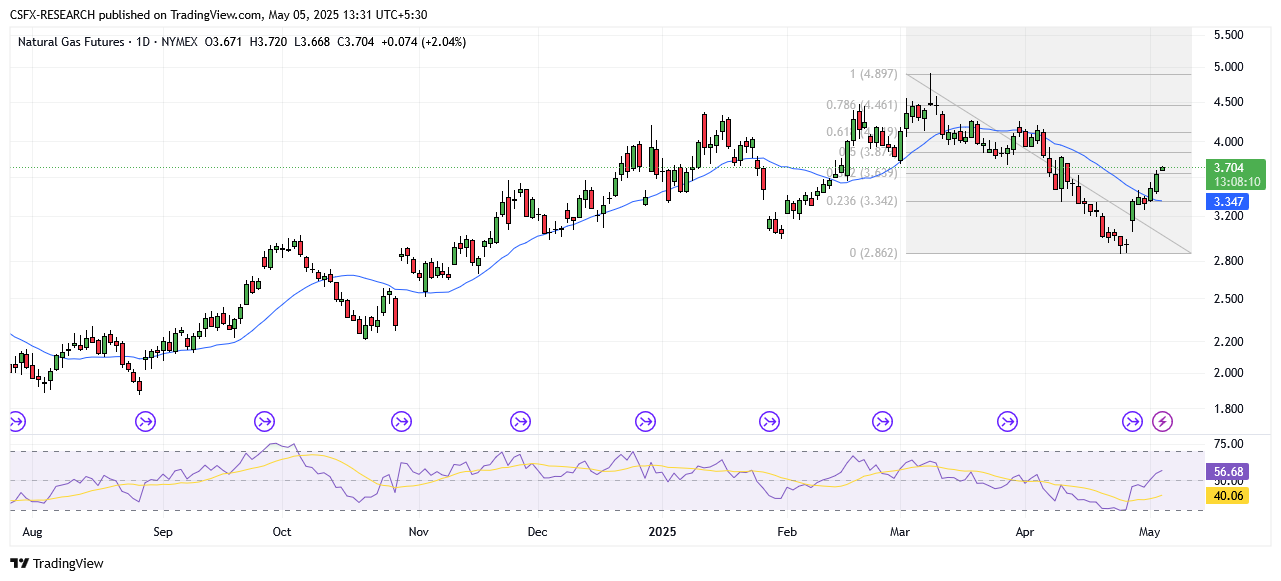
Natural Gas prices have broken above the key $3.67 pivot and the 200 EMA, signaling strong bullish momentum. Prices are consolidating around $3.691 with potential to rally toward the $4.00 mark.
Key Developments:
- Breakout above 200 EMA ($3.474) and 50 EMA ($3.461).
- Supportive trend structure with higher lows in place.
- Buyers likely to re-enter above $3.538 support.
- A move above $3.789 could trigger acceleration towards $4.00.
Technical Overview
Moving Averages
Exponential Moving Averages:
- MA 10: 3.35 | Positive Crossover | Bullish
- MA 20: 3.41 | Positive Crossover | Bullish
- MA 50: 3.60 | Positive Crossover | Bullish
Simple Moving Averages:
- MA 10: 3.23 | Positive Crossover | Bullish
- MA 20: 3.32 | Positive Crossover | Bullish
- MA 50: 3.80 | Negative Crossover | Bearish
Indicators
- RSI: 54.97 | Buy Zone | Bullish
- Stochastic Oscillator: 84.84 | Buy Zone
Key Levels
- Resistance: R1: 3.94 | R2: 4.24
- Support: S1: 2.95 | S2: 2.64
Overall Sentiment: Bullish
Market Direction: Buy
Trade Suggestion:
- Entry: Limit Buy at 3.56
- Target: Take Profit at 3.95
- Risk: Stop Loss at 3.37
Commodity Market Summary
- Gold: Up 0.73% at 3264.10
- Silver: Up 1.04% at 32.32
- Palladium: Up 1.18% at 961.53
- Platinum: Up 0.21% at 965.82
- Brent Crude Oil: Down 2.33% at 60.05
- WTI Crude Oil: Down 2.58% at 57.07
Key Economic Events Today
- CHF: Consumer Price Index (MoM) (Apr)
- Forecast: 0.2% | Previous: 0.0% | Release Time: 12:00
- USD: S&P Global Services PMI (Apr)
- Forecast: 51.4 | Previous: 54.4 | Release Time: 19:15
- USD: ISM Non-Manufacturing PMI (Apr)
- Forecast: 50.2 | Previous: 50.8 | Release Time: 19:30