

Gold prices remain steady near $2,900, supported by trade war concerns, but struggle to extend gains amid a recovering U.S. Dollar and market optimism over geopolitical developments. Silver shows strong bullish momentum, while WTI oil prices stabilize above $70.50, with attention on potential Russia-Ukraine peace talks.
KEY HIGHLIGHTS
- Gold Steady Near $2,900 Amid Dollar Recovery
- Silver Rises Toward $32.50, Strong Bullish Momentum
- WTI Oil Holds Above $70.50 Amid Peace Talks
- Natural Gas Trades Near $3.63, Volatility Persists
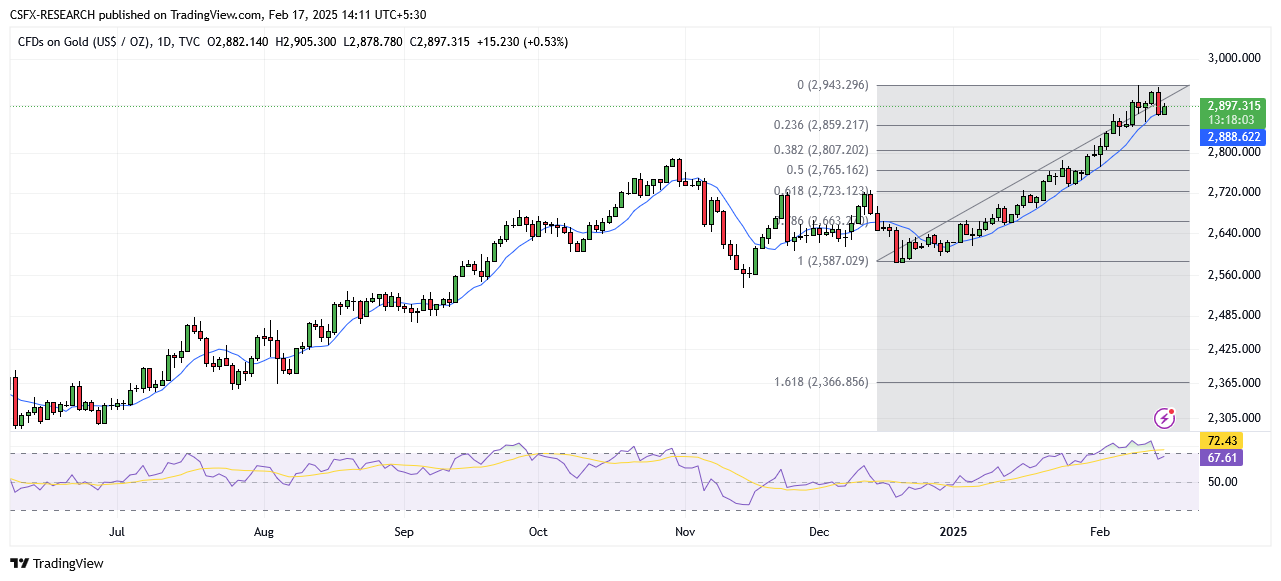
Gold Holds Steady Near $2,900 Amid Trade War Concerns
Gold prices remain stable around $2,900, supported by lingering trade war fears, but struggle to gain further momentum due to a recovering U.S. Dollar and improved market sentiment over geopolitical developments. The safe-haven metal remains in demand as global uncertainties persist, yet the renewed strength of the greenback and optimism surrounding U.S.-Russia negotiations over the Ukraine conflict limit its upside potential.
Technical Analysis:

- Exponential Moving Averages (EMA):
- MA 10: 2876.14 | Bullish
- MA 20: 2832.71 | Bullish
- MA 50: 2755.91 | Bullish
- Simple Moving Averages (SMA):
- MA 10: 2884.03 | Bullish
- MA 20: 2826.53 | Bullish
- MA 50: 2722.50 | Bullish
- RSI (Relative Strength Index): 67.62 | Buy Zone | Bullish
- Stochastic Oscillator: 80.42 | Neutral
- Resistance Levels: R1: 2820.47 | R2: 2868.24
- Support Levels: S1: 2665.83 | S2: 2618.06
Market Sentiment: Bullish
Trade Suggestion: Limit Buy at 2887.61, Take Profit at 2920.24, Stop Loss at 2869.19
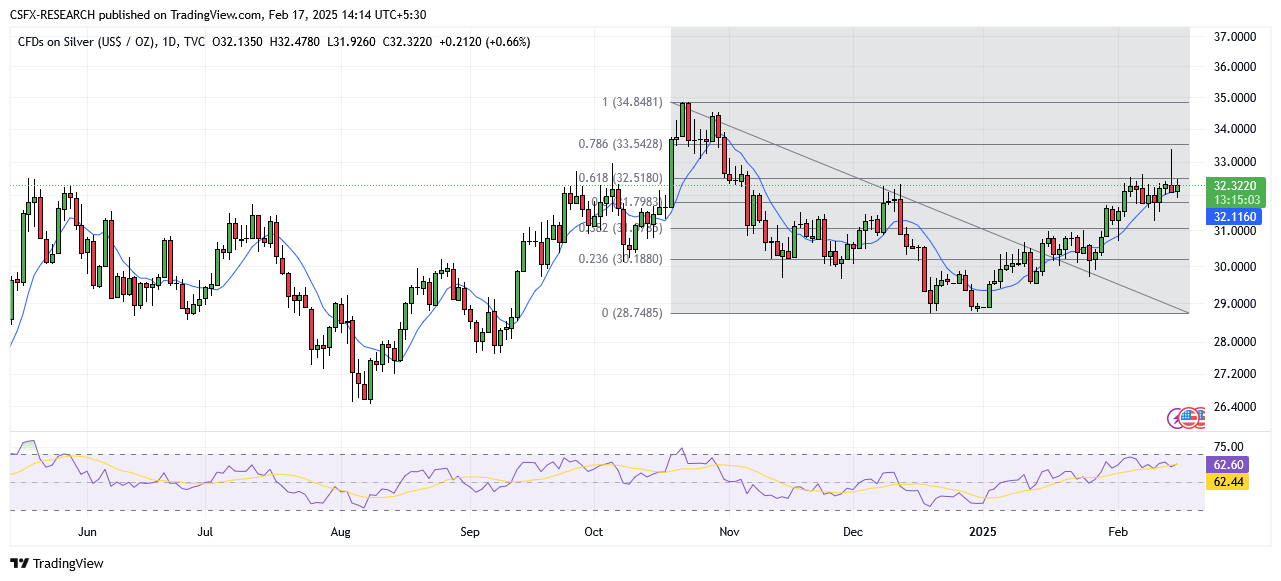
Silver Climbs Toward $32.50 With Strong Bullish Momentum
Silver prices (XAG/USD) are on the rise, trading near $32.40 per troy ounce after rebounding from recent losses. The metal maintains a bullish trend, supported by strong technical indicators, with prices moving within an ascending channel. Silver remains above key moving averages, reinforcing the short-term positive outlook.
Technical Analysis:
- Exponential Moving Averages (EMA):
- MA 10: 31.96 | Bullish
- MA 20: 31.55 | Bullish
- MA 50: 31.04 | Bullish
- Simple Moving Averages (SMA):
- MA 10: 32.09 | Bullish
- MA 20: 31.45 | Bullish
- MA 50: 30.36 | Bullish
- RSI (Relative Strength Index): 62.65 | Bullish
- Stochastic Oscillator: 63.55 | Neutral
- Resistance Levels: R1: 32.52 | R2: 33.32
- Support Levels: S1: 31.64 | S2: 30.81
Market Sentiment: Neutral
Trade Suggestion: Limit Buy at 32.45, Take Profit at 33.35, Stop Loss at 31.99
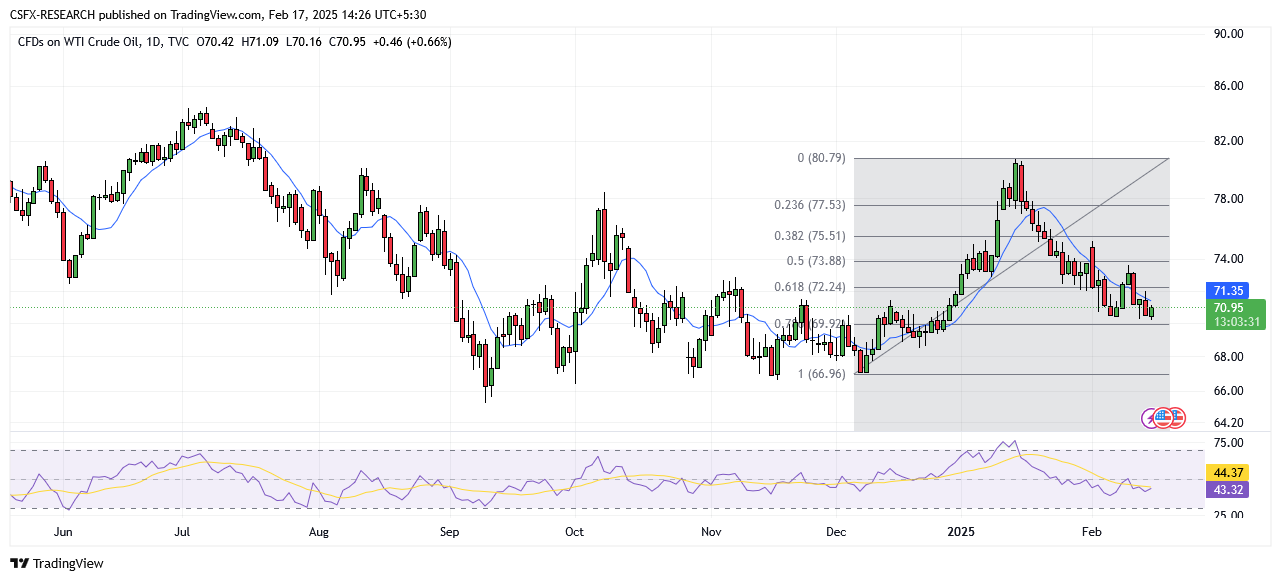
WTI Oil Holds Above $70.50 As Russia-Ukraine Peace Talks Progress
West Texas Intermediate (WTI) crude oil remains stable above $70.50, with investors closely monitoring ongoing peace negotiations between Russia and Ukraine. The potential for easing sanctions on Moscow could increase global oil supply, pressuring prices. However, optimism over trade agreements and potential U.S. policy shifts provide stability to the market.
Technical Analysis:
- Exponential Moving Averages (EMA):
- MA 10: 71.72 | Bearish
- MA 20: 72.45 | Bearish
- MA 50: 72.54 | Bearish
- Simple Moving Averages (SMA):
- MA 10: 71.52 | Bearish
- MA 20: 72.73 | Bearish
- MA 50: 72.63 | Bearish
- RSI (Relative Strength Index): 42.94 | Neutral
- Stochastic Oscillator: 17.13 | Sell Zone | Neutral
- Resistance Levels: R1: 78.85 | R2: 80.97
- Support Levels: S1: 71.99 | S2: 69.87
Market Sentiment: Bearish
Trade Suggestion: Limit Sell at 71.28, Take Profit at 70.02, Stop Loss at 72.20
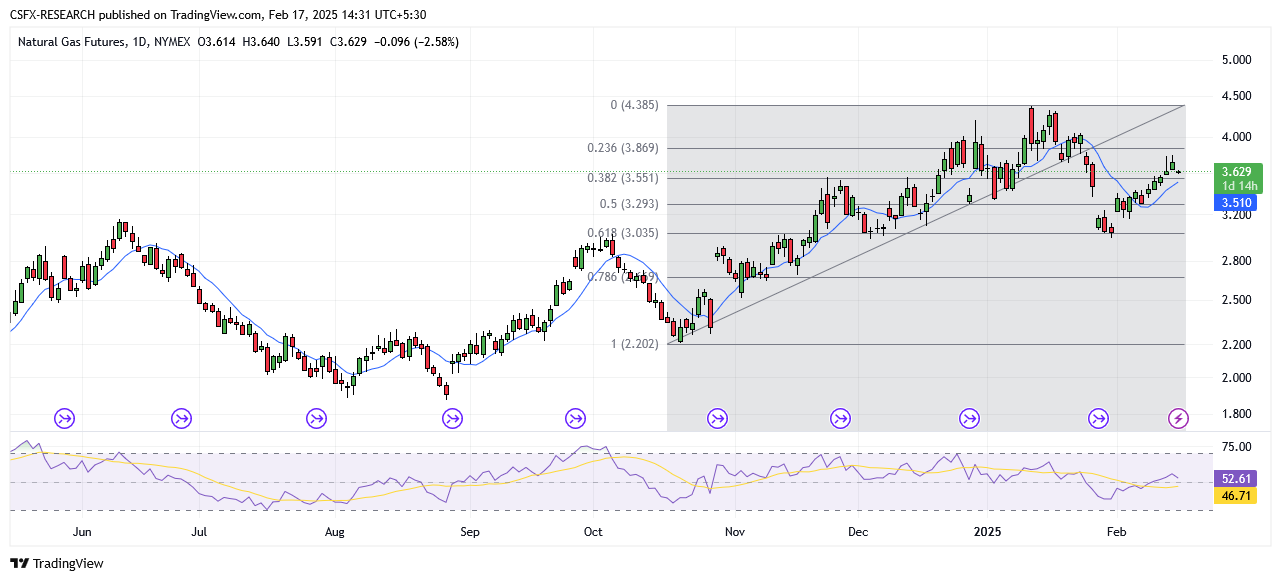
Natural Gas Volatility Persists Amid Geopolitical Uncertainty
Natural gas (NG) trades around $3.63, hovering above the key pivot level of $3.605. The 50-day EMA at $3.606 serves as immediate support, with bullish momentum intact. However, any drop below this threshold could trigger a decline toward $3.490 and beyond. A decisive break above $3.790 could fuel further buying pressure, making volume analysis critical before taking positions.
Technical Analysis:
- Exponential Moving Averages (EMA):
- MA 10: 3.71 | Bullish
- MA 20: 3.68 | Bullish
- MA 50: 3.53 | Bullish
- Simple Moving Averages (SMA):
- MA 10: 3.67 | Bullish
- MA 20: 3.66 | Bullish
- MA 50: 3.59 | Bullish
- RSI (Relative Strength Index): 53.19 | Bullish
- Stochastic Oscillator: 78.89 | Neutral
- Resistance Levels: R1: 4.08 | R2: 4.33
- Support Levels: S1: 3.25 | S2: 3.00
Market Sentiment: Bullish
Trade Suggestion: Limit Buy at 3.53, Take Profit at 3.99, Stop Loss at 3.36
Elsewhere in the Commodity Market
- Gold up 0.49% at $2896.36
- Silver up 0.44% at $32.25
- Palladium up 2.39% at $979.40
- Platinum up 1.06% at $983.00
- Brent Crude Oil up 0.67% at $74.99
- WTI Crude Oil up 0.51% at $70.98
Key Economic Events & Data Releases Today:
- (JPY) GDP (QoQ) (Q4): Forecast 1.0%, Previous 1.7% (05:20 GMT)
- (EUR) Eurogroup Meetings: 15:30 GMT
This article is designed to improve SEO rankings, enhance reader engagement, and maximize traffic by incorporating relevant keywords and market insights. Let me know if you need any refinements! 🚀