

Commodity prices show mixed performance today, driven by geopolitical tensions, trade uncertainties, and movements in the US Dollar. Gold continues to gain amid safe-haven demand, while silver also rises following new tariff threats. Oil stages a modest recovery despite supply concerns, and natural gas maintains bullish momentum with potential for an upward breakout.
KEY HIGHLIGHTS
- Gold rises on geopolitical tensions and weaker US Dollar outlook.
- Silver climbs as Trump’s new tariffs boost safe-haven demand.
- WTI oil rebounds despite OPEC+ production hike supply concerns.
- Natural gas holds gains, eyes breakout above key resistance
Gold (XAU/USD)
Safe-Haven Demand Supports Gold Prices Ahead of Fed Decision
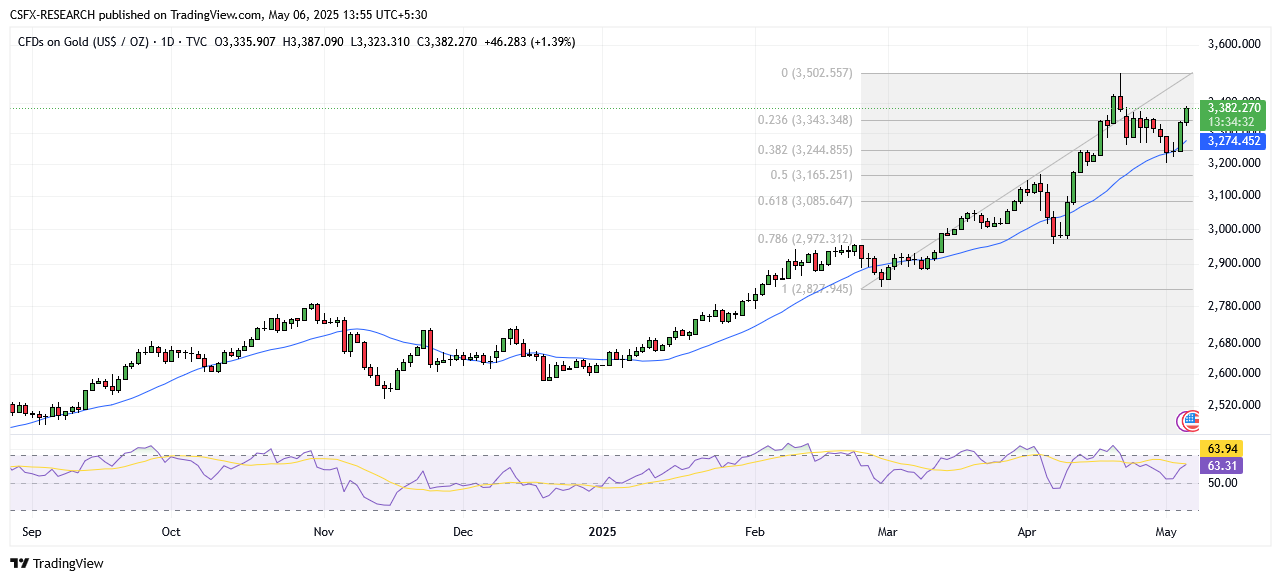
Gold prices are holding modest gains near a two-week high as investors await the outcome of the Federal Reserve’s monetary policy meeting. The precious metal benefits from multiple macroeconomic and geopolitical drivers, despite some optimism around reduced US-China trade tensions.
Key Drivers
- Investor caution surrounding US President Donald Trump’s trade policies
- Geopolitical unrest in Ukraine and the Middle East
- Weakness in the US Dollar supporting safe-haven assets
- Market anticipation of the FOMC decision
Technical Overview

Moving Averages
Exponential:
- MA 10: 3306.69 | Positive Crossover | Bullish
- MA 20: 3263.63 | Positive Crossover | Bullish
- MA 50: 3133.17 | Positive Crossover | Bullish
Simple:
- MA 10: 3309.61 | Positive Crossover | Bullish
- MA 20: 3274.13 | Positive Crossover | Bullish
- MA 50: 3103.05 | Positive Crossover | Bullish
Indicators
- RSI: 63.16 | Buy Zone | Bullish
- Stochastic Oscillator: 39.61 | Sell Zone | Neutral
Support and Resistance Levels
- R1: 3455.95
- R2: 3584.20
- S1: 3040.74
- S2: 2912.49
Market Outlook: Bullish
Market Direction: Buy
Trade Suggestion:
- Entry: Limit Buy at 3335.00
- Take Profit: 3421.30
- Stop Loss: 3288.34
Silver (XAG/USD)
Silver Rises on Renewed Tariff Concerns
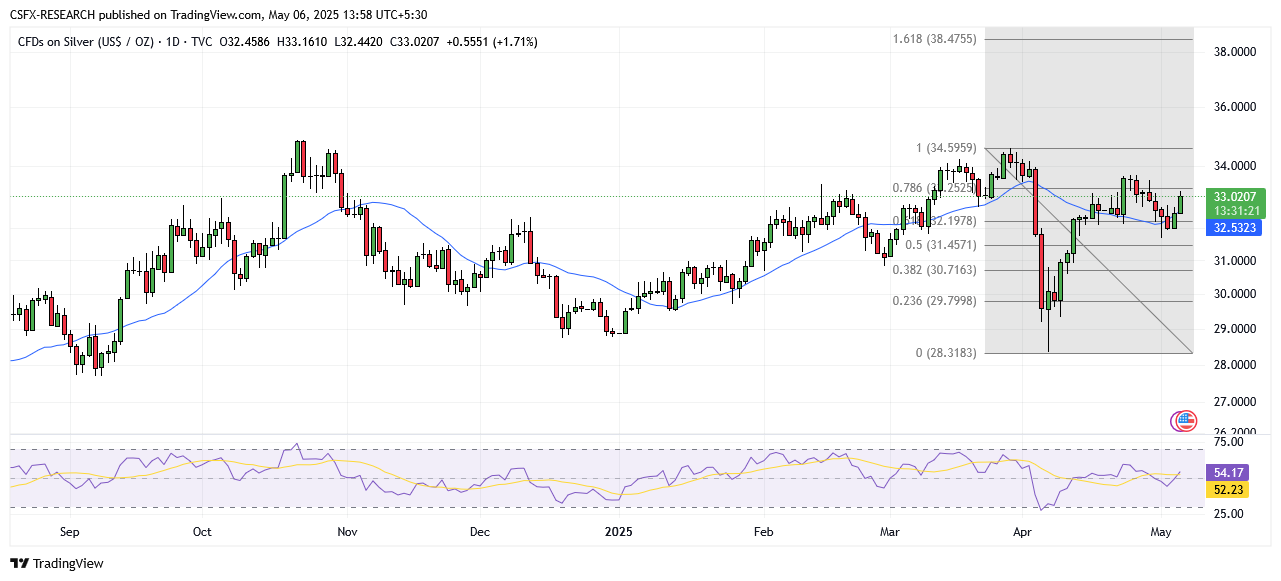
Silver prices advance above $33.00, driven by increased safe-haven demand following new tariff threats from President Trump. However, gains may be capped if the US Dollar strengthens ahead of the Fed’s decision.
Key Drivers
- Trump’s 100% tariff proposal on foreign films and upcoming pharma tariffs
- Safe-haven demand amid trade uncertainty
- USD strength may limit silver’s upside
Technical Overview
Moving Averages
Exponential:
- MA 10: 32.85 | Positive Crossover | Bullish
- MA 20: 32.38 | Positive Crossover | Bullish
- MA 50: 31.60 | Positive Crossover | Bullish
Simple:
- MA 10: 32.63 | Positive Crossover | Bullish
- MA 20: 32.59 | Positive Crossover | Bullish
- MA 50: 32.00 | Positive Crossover | Bullish
Indicators
- RSI: 53.81 | Buy Zone | Bullish
- Stochastic Oscillator: 32.84 | Sell Zone | Neutral
Support and Resistance Levels
- R1: 33.35
- R2: 34.44
- S1: 32.38
- S2: 31.62
Market Outlook: Neutral
Market Direction: Buy
Trade Suggestion:
- Entry: Limit Buy at 32.73
- Take Profit: 33.66
- Stop Loss: 32.26
Crude Oil (WTI)
WTI Rebounds Despite Supply Concerns
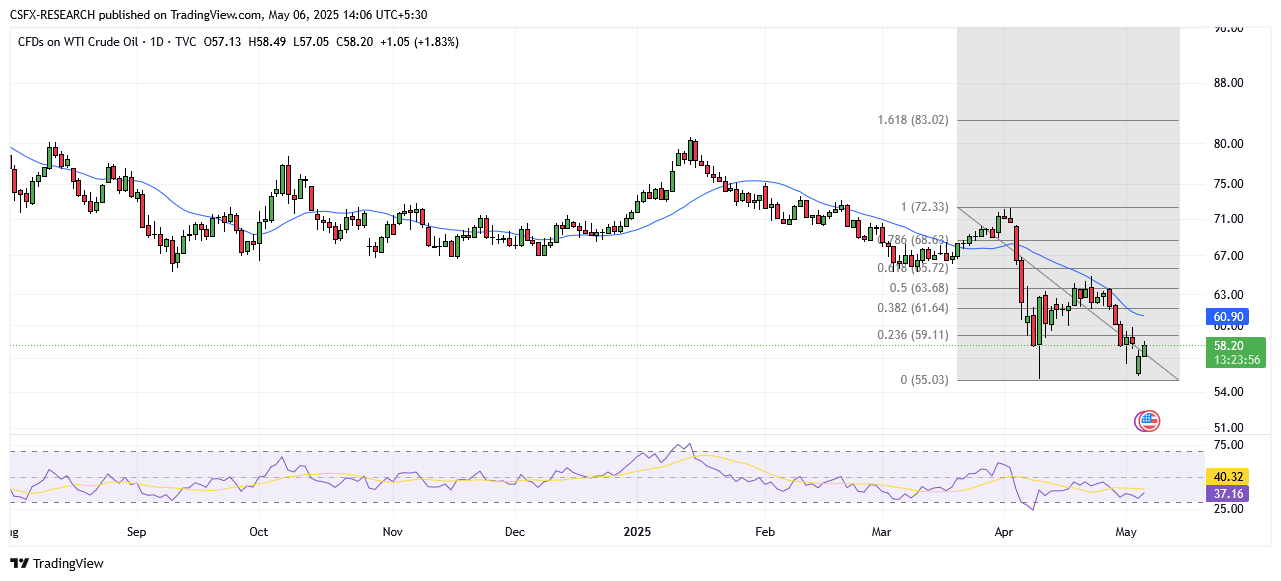
WTI crude oil prices are recovering above $58.00 per barrel after a previous sharp decline. However, the outlook remains cautious due to increased global supply, particularly following OPEC+ production decisions.
Key Drivers
- OPEC+ adds 411,000 bpd for June, with more potential increases ahead
- Saudi Arabia pressures members to comply with quotas
- Possible reversal of voluntary cuts by October
Technical Overview
Moving Averages
Exponential:
- MA 10: 59.66 | Negative Crossover | Bearish
- MA 20: 61.32 | Negative Crossover | Bearish
- MA 50: 64.54 | Negative Crossover | Bearish
Simple:
- MA 10: 60.11 | Negative Crossover | Bearish
- MA 20: 61.03 | Negative Crossover | Bearish
- MA 50: 65.15 | Negative Crossover | Bearish
Indicators
- RSI: 36.64 | Sell Zone | Bearish
- Stochastic Oscillator: 24.86 | Sell Zone | Neutral
Support and Resistance Levels
- R1: 68.40
- R2: 72.45
- S1: 55.30
- S2: 51.25
Market Outlook: Bearish
Market Direction: Sell
Trade Suggestion:
- Entry: Limit Sell at 58.54
- Take Profit: 56.35
- Stop Loss: 60.06
Natural Gas
Natural Gas Holds Bullish Trend; Eyes Breakout
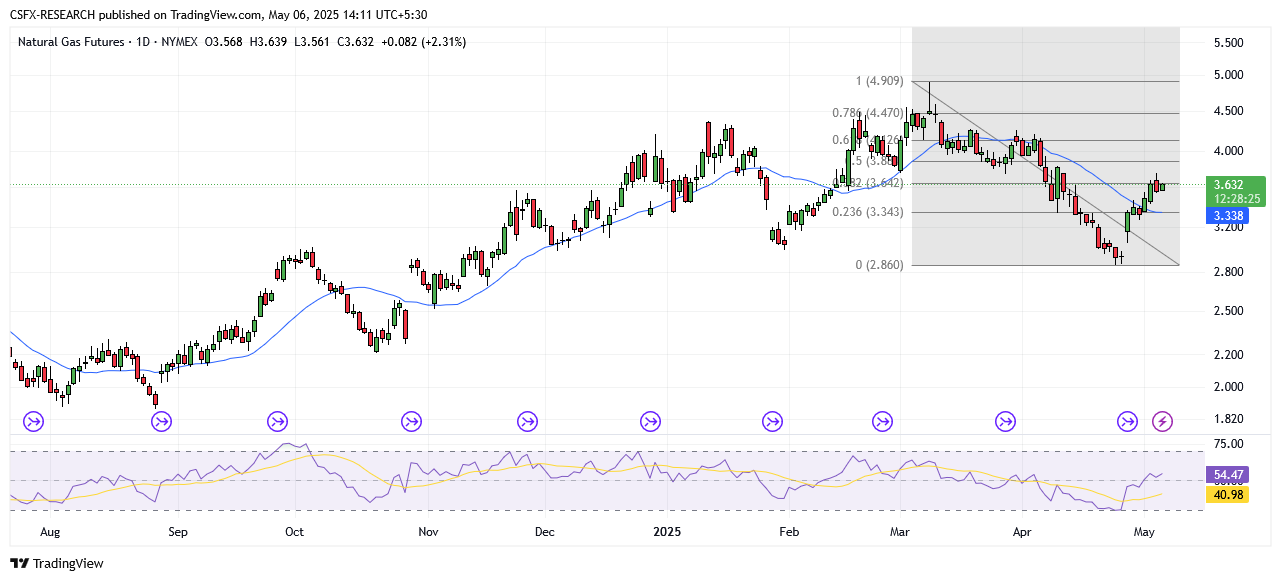
Natural gas prices remain firm above $3.62, supported by a strong uptrend and a bullish technical structure. A breakout above key resistance at $3.72 could open the path to $4.01.
Key Drivers
- Bullish ascending trendline support near $3.56
- 50 EMA at $3.52 acting as dynamic support
- Breakout potential toward $3.86 and $4.01
Technical Overview
Moving Averages
Exponential:
- MA 10: 3.3680 | Positive Crossover | Bullish
- MA 20: 3.4079 | Positive Crossover | Bullish
- MA 50: 3.5913 | Negative Crossover | Bearish
Simple:
- MA 10: 3.2706 | Positive Crossover | Bullish
- MA 20: 3.3111 | Positive Crossover | Bullish
- MA 50: 3.7896 | Negative Crossover | Bearish
Indicators
- RSI: 52.60 | Buy Zone | Bullish
- Stochastic Oscillator: 85.40 | Buy Zone | Neutral
Support and Resistance Levels
- R1: 3.9384
- R2: 4.2443
- S1: 2.9483
- S2: 2.6424
Market Outlook: Bullish
Market Direction: Buy
Trade Suggestion:
- Entry: Limit Buy at 3.49
- Take Profit: 3.74
- Stop Loss: 3.36
Other Commodities Performance
- Gold: Up 1.24% at 3377.94
- Silver: Up 1.78% at 33.03
- Palladium: Up 0.92% at 951.39
- Platinum: Up 1.66% at 978.23
- Brent Crude Oil: Up 2.04% at 61.53
- WTI Crude Oil: Up 1.90% at 58.29
Key Economic Data to Watch
- Australia: Building Approvals (MoM) (April)
- Forecast: -1.7%
- Previous: -0.2%
- Release Time: 07:00