
KEY HIGHLIGHTS
- Gold Near $2,690 Amid Weaker USD and Optimism
- Silver Climbs Above $30, Cautious Trading Remains Key
- Crude Oil Steady Above $76, Sanctions Tighten Supply
- Natural Gas Volatile, Weather Key to Market Trends
INTRODUCTION
Gold, silver, crude oil, and natural gas markets exhibit mixed dynamics influenced by global factors, including US inflation data, geopolitical events, and weather forecasts. Gold approaches a crucial resistance level at $2,690, driven by a weaker US Dollar (USD), while silver reclaims the $30.00 mark, reflecting cautious optimism. Crude oil and natural gas show varying trends shaped by supply constraints and weather-driven demand.
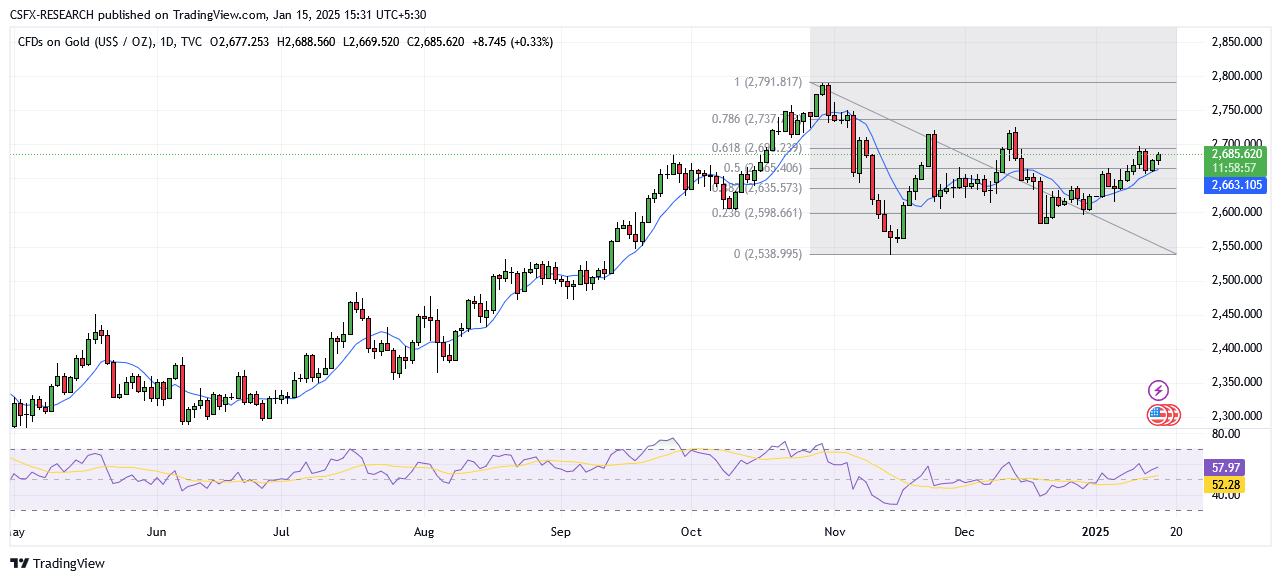
Gold Near $2,690: Bullish Momentum Amid Weaker USD
Gold prices (XAU/USD) have edged closer to the critical $2,690 resistance level, bolstered by dip-buying near $2,669 and a softer USD. The US Dollar’s recent decline follows weaker US Producer Price Index (PPI) data, adding strength to gold’s appeal.
While investor sentiment remains risk-on due to reduced fears of disruptive US trade tariffs and strong US jobs data, expectations of a hawkish Federal Reserve may cap further gains. Gold’s appeal as a non-yielding asset faces pressure from higher US Treasury bond yields. Market participants now await the US Consumer Price Index (CPI) data for December, which could further influence gold’s direction.
Technical Overview:
- Exponential Moving Averages (EMA):
- MA 10: 2662.93 | Positive Crossover | Bullish
- MA 20: 2653.00 | Positive Crossover | Bullish
- MA 50: 2645.03 | Positive Crossover | Bullish
- Simple Moving Averages (SMA):
- MA 10: 2662.06 | Positive Crossover | Bullish
- MA 20: 2637.85 | Positive Crossover | Bullish
- MA 50: 2641.49 | Positive Crossover | Bullish
- Indicators:
- RSI: 57.08 | Buy Zone | Bullish
- Stochastic Oscillator: 75.98 | Buy Zone | Neutral
Resistance and Support Levels:
- R1: 2699.10 | R2: 2732.82
- S1: 2589.90 | S2: 2556.17
Trade Suggestion:
- Limit Buy: 2675.84
- Take Profit: 2699.00
- Stop Loss: 2662.93
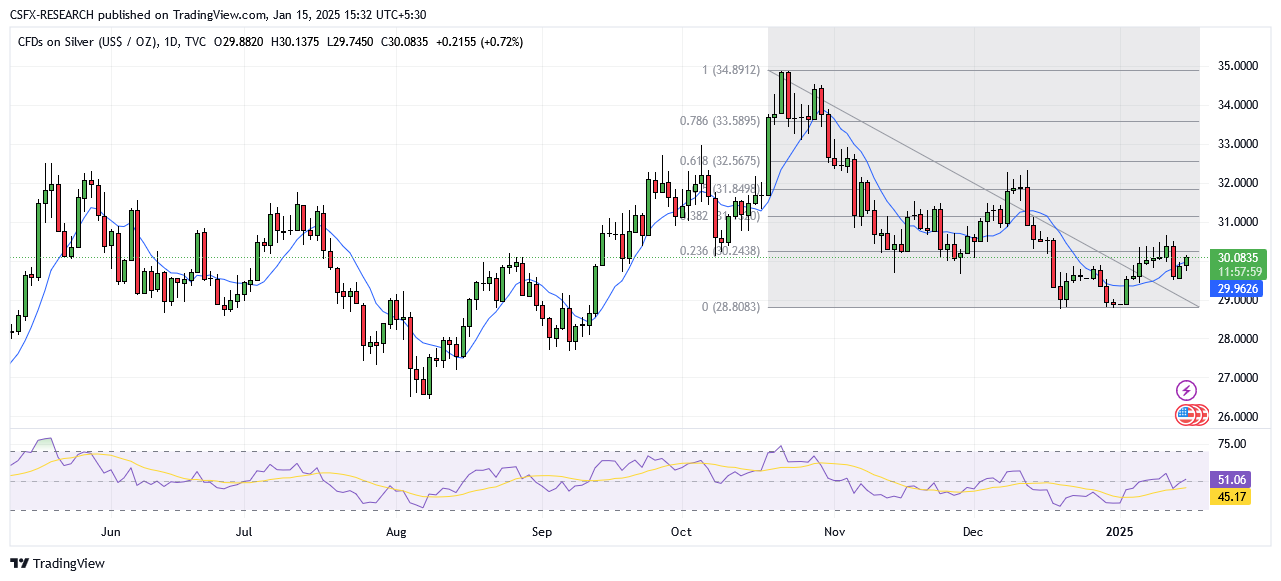
Silver Climbs Above $30: Key Levels to Watch
Silver (XAG/USD) reclaimed the $30.00 psychological level, supported by renewed buying interest. Despite its upward momentum, traders should exercise caution as silver faces resistance near $30.45, within a descending channel that signals a prevailing downtrend.
While daily oscillators show recovery from bearish levels, the lack of strong positive momentum suggests limited upside. A break above the 100-day SMA at $31.00 could end the ongoing corrective decline and pave the way for further gains. Key resistance lies at $31.70 and the December swing high of $32.30-$32.35.
Technical Overview:
- Exponential Moving Averages (EMA):
- MA 10: 29.88 | Positive Crossover | Bullish
- MA 20: 29.64 | Positive Crossover | Bullish
- MA 50: 30.34 | Negative Crossover | Bearish
- Simple Moving Averages (SMA):
- MA 10: 29.90 | Positive Crossover | Bullish
- MA 20: 29.70 | Positive Crossover | Bullish
- MA 50: 30.25 | Negative Crossover | Bearish
- Indicators:
- RSI: 50.28 | Buy Zone | Bullish
- Stochastic Oscillator: 68.17 | Buy Zone | Positive
Resistance and Support Levels:
- R1: 30.64 | R2: 31.71
- S1: 29.66 | S2: 28.68
Trade Suggestion:
- Limit Buy: 29.66
- Take Profit: 30.93
- Stop Loss: 28.83
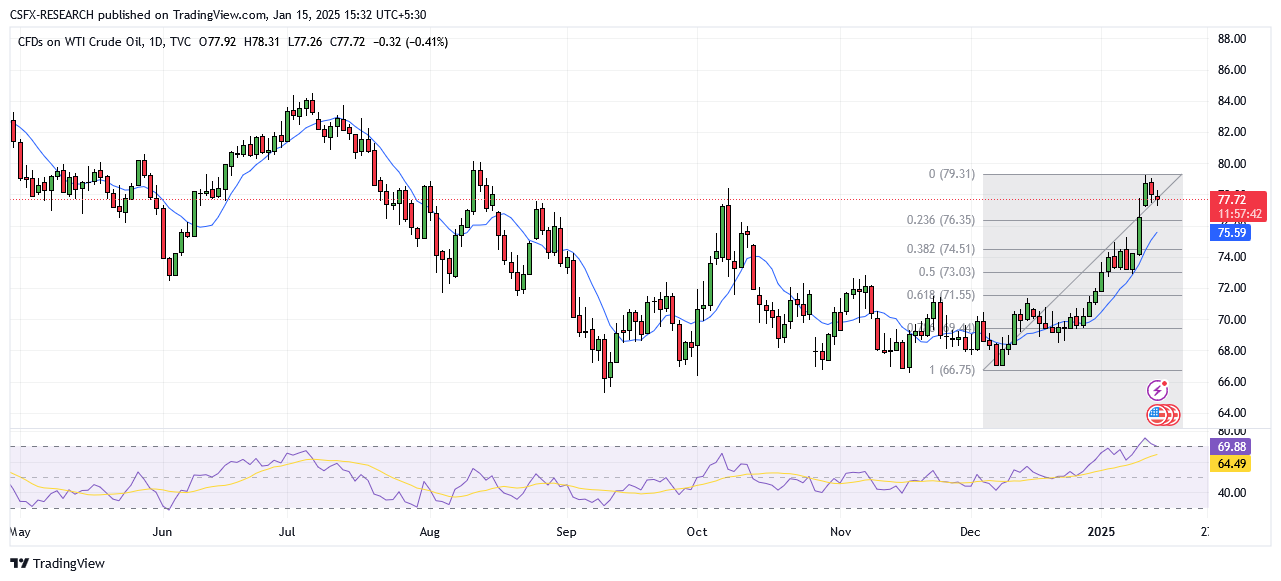
Crude Oil Steady Above $76.50: Supply Concerns in Focus
West Texas Intermediate (WTI) crude oil trades near $76.75, buoyed by US sanctions on Russian oil exports. These measures have raised concerns about tighter global supplies, counterbalancing projections of steady US oil demand in the coming years.
New US sanctions targeting Russian vessels and major producers have heightened fears of supply disruptions. However, the US Energy Information Administration (EIA) expects domestic production to increase, potentially weighing on prices. Traders await US CPI data, as a softer-than-expected reading could weaken the USD, boosting WTI prices.
Technical Overview:
- Exponential Moving Averages (EMA):
- MA 10: 75.61 | Positive Crossover | Bullish
- MA 20: 73.74 | Positive Crossover | Bullish
- MA 50: 71.92 | Positive Crossover | Bullish
- Simple Moving Averages (SMA):
- MA 10: 75.39 | Positive Crossover | Bullish
- MA 20: 72.77 | Positive Crossover | Bullish
- MA 50: 70.71 | Positive Crossover | Bullish
- Indicators:
- RSI: 70.50 | Buy Zone | Bullish
- Stochastic Oscillator: 89.95 | Buy Zone | Neutral
Resistance and Support Levels:
- R1: 72.21 | R2: 73.40
- S1: 68.36 | S2: 67.17
Trade Suggestion:
- Limit Buy: 76.47
- Take Profit: 79.57
- Stop Loss: 74.83
Natural Gas Update: Volatility Amid Weather Forecasts
Natural gas futures dipped below $4, with weather forecasts driving volatility. While a current cold snap boosts short-term demand, bearish sentiment dominates due to expectations of warmer weather later in January.
Hedge funds have intensified selling into rallies, exacerbating market volatility. Traders focus on late-January weather forecasts and LNG export trends for broader market direction. While an Arctic blast between January 19-24 may provide temporary support, uncertainty persists.
Technical Overview:

- Exponential Moving Averages (EMA):
- MA 10: 3.81 | Positive Crossover | Bullish
- MA 20: 3.64 | Positive Crossover | Bullish
- MA 50: 3.27 | Positive Crossover | Bullish
- Simple Moving Averages (SMA):
- MA 10: 3.77 | Positive Crossover | Bullish
- MA 20: 3.63 | Positive Crossover | Bullish
- MA 50: 3.19 | Positive Crossover | Bullish
- Indicators:
- RSI: 60.29 | Buy Zone | Bullish
- Stochastic Oscillator: 63.63 | Buy Zone | Neutral
Resistance and Support Levels:
- R1: 4.15 | R2: 4.50
- S1: 3.02 | S2: 2.67
Trade Suggestion:
- Limit Buy: 3.74
- Take Profit: 4.20
- Stop Loss: 3.48
Commodity Market Snapshot:
- Gold: Up 0.33% at $2685.54
- Silver: Up 0.59% at $30.40
- Palladium: Up 0.89% at $948.16
- Platinum: Up 0.56% at $959.85
- Brent Crude Oil: Down 0.08% at $79.54
- WTI Crude Oil: Down 0.28% at $77.83
Key Economic Events Today:
- GBP CPI (YoY) (Dec): Forecast 2.6%, Previous 2.6% at 12:30
- USD Core CPI (MoM) (Dec): Forecast 0.3%, Previous 0.3% at 19:00
- USD CPI (YoY) (Dec): Forecast 2.9%, Previous 2.7% at 19:00