

Gold, silver, crude oil, and natural gas are showing mixed performances as global markets react to changing risk sentiment, supply conditions, and anticipation of key US economic data. Precious metals are under pressure from easing safe-haven demand, while energy commodities reflect supply-side volatility and technical momentum, pointing to a volatile trading environment ahead.
KEY HIGHLIGHTS
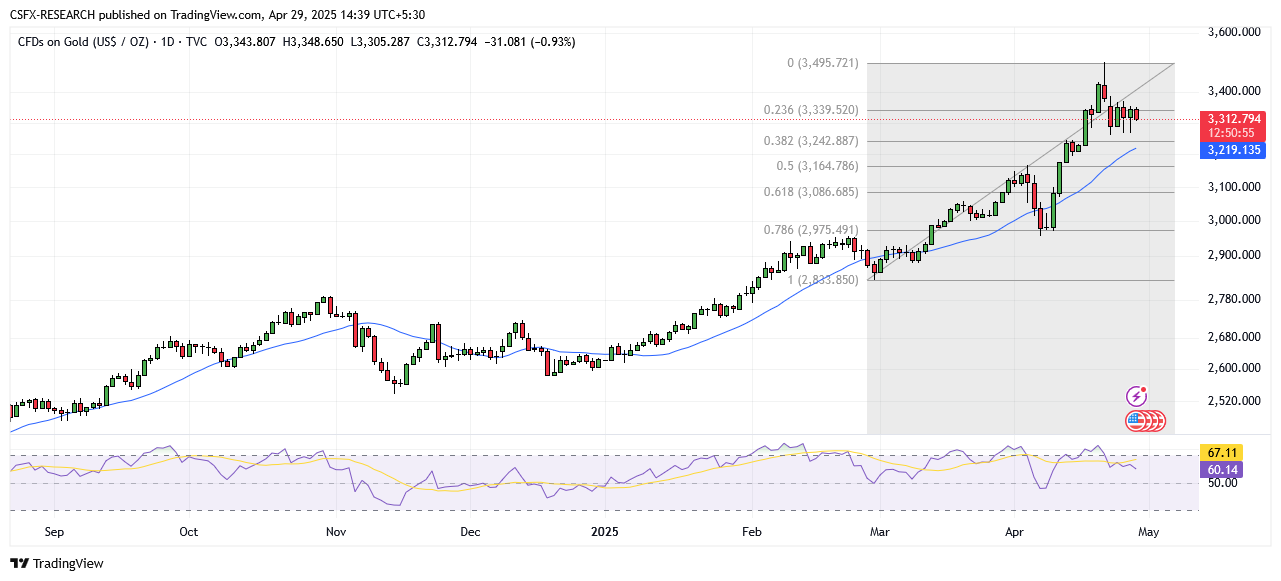
- Gold Rebounds Slightly, Still Weak Amid Fading Safe-Haven Demand
- Silver Pressured Near $33 As Industrial Demand and Dollar Strengthen
- Crude Oil Stays Weak Near $61.75 On Demand Concerns
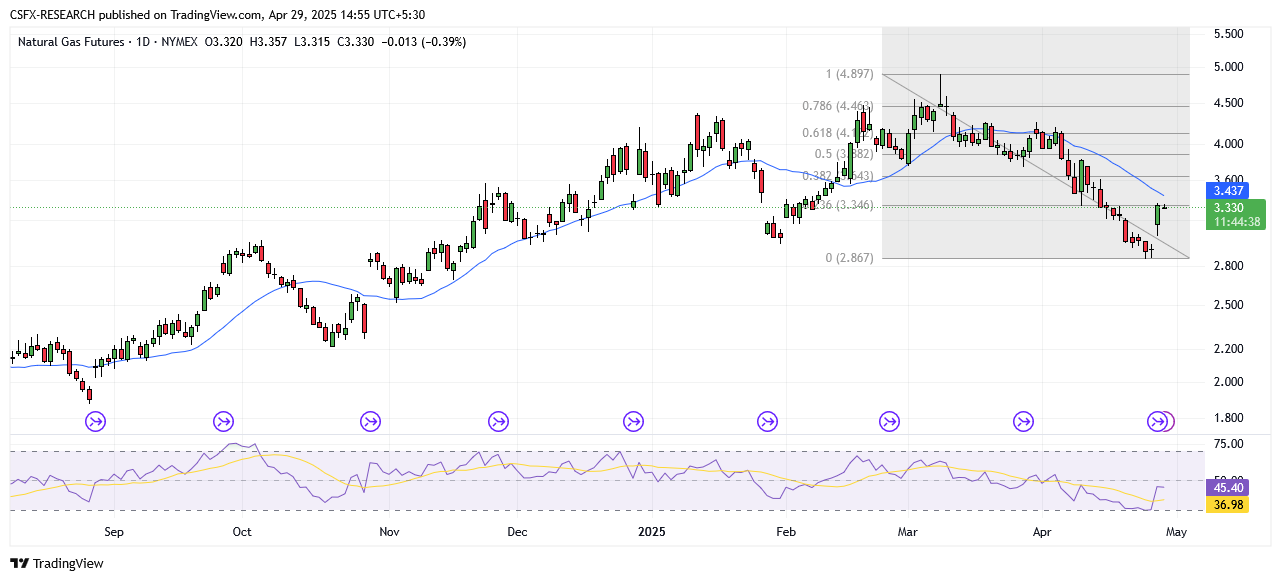
- Natural Gas Breaks Resistance, Signals Bullish Trend Reversal Ahead
Gold (XAU/USD): Rebounds Slightly, But Bearish Pressure Persists
Market Overview
Gold prices have rebounded modestly from the $3,300 level but remain under pressure as optimism around US-China trade relations reduces safe-haven appeal.
- Renewed US Dollar strength is capping gold’s upside.
- Hopes of de-escalation in trade tensions weigh on demand for non-yielding assets.
- Market participants await US data releases this week, especially the Fed’s preferred inflation measure and the Nonfarm Payrolls report, which could guide the next significant move.
Technical Overview

Exponential Moving Averages (EMA)
- EMA 10: 3303.47 – Positive Crossover (Bullish)
- EMA 20: 3238.34 – Positive Crossover (Bullish)
- EMA 50: 3096.40 – Positive Crossover (Bullish)
Simple Moving Averages (SMA)
- SMA 10: 3331.01 – Negative Crossover (Bearish)
- SMA 20: 3219.05 – Positive Crossover (Bullish)
- SMA 50: 3067.24 – Positive Crossover (Bullish)
Indicators
- RSI: 60.15 – Buy Zone (Bullish)
- Stochastic Oscillator: 67.22 – Buy Zone (Neutral)
Support and Resistance Levels
- Resistance: R1: 3139.50 | R2: 3203.71
- Support: S1: 2931.64 | S2: 2867.44
Outlook
- Overall Sentiment: Bullish
- Market Direction: Buy
- Trade Suggestion:
- Limit Buy: 3273.00
- Take Profit: 3373.50
- Stop Loss: 3211.60
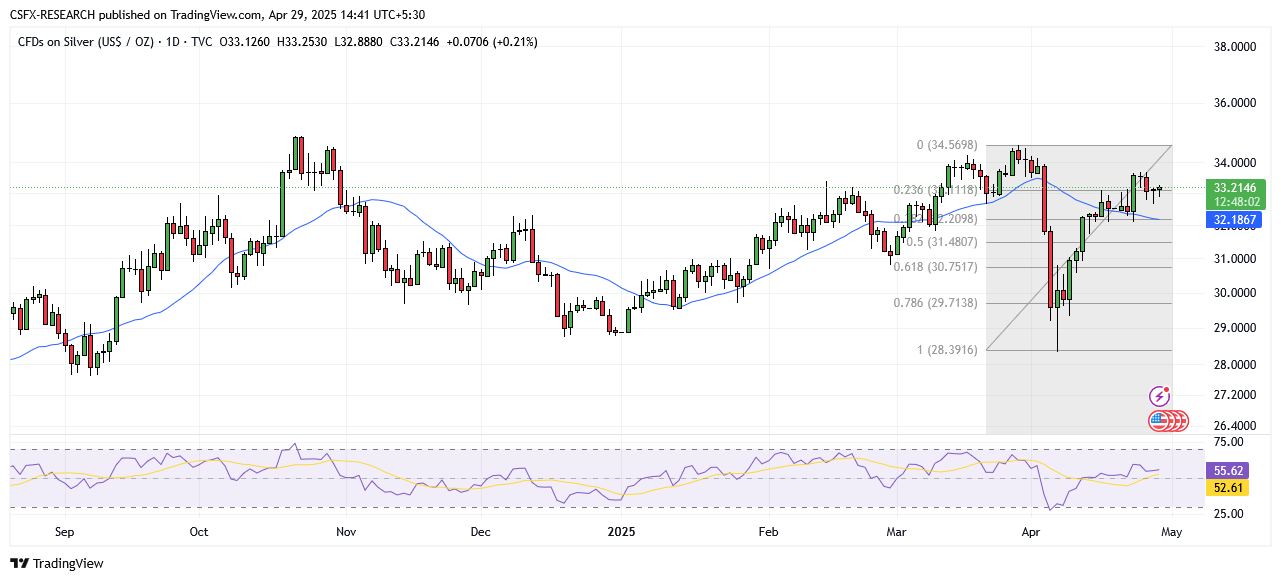
Silver (XAG/USD): Slips Near $33.00 as Industrial Demand Eases
Market Overview
Silver prices are under slight pressure during the Asian session, slipping back toward $33.00 due to fading safe-haven demand and a stronger US Dollar.
- Dollar strength and trade optimism reduce demand for silver.
- Traders are focused on upcoming US data: Q1 GDP, PCE inflation, and NFP.
Technical Overview
Exponential Moving Averages (EMA)
- EMA 10: 32.91 – Positive Crossover (Bullish)
- EMA 20: 32.23 – Positive Crossover (Bullish)
- EMA 50: 31.63 – Positive Crossover (Bullish)
Simple Moving Averages (SMA)
- SMA 10: 32.89 – Positive Crossover (Bullish)
- SMA 20: 32.69 – Positive Crossover (Bullish)
- SMA 50: 31.96 – Positive Crossover (Bullish)
Indicators
- RSI: 55.47 – Buy Zone (Bullish)
- Stochastic Oscillator: 83.26 – Buy Zone (Neutral)
Support and Resistance Levels
- Resistance: R1: 33.65 | R2: 34.85
- Support: S1: 32.62 | S2: 31.48
Outlook
- Overall Sentiment: Bullish
- Market Direction: Buy
- Trade Suggestion:
- Limit Buy: 32.93
- Take Profit: 33.70
- Stop Loss: 32.48
Crude Oil (WTI): Hovers Near $61.75 Amid Demand Concerns
Market Overview
WTI crude oil remains range-bound, hovering near $61.75, pressured by global demand concerns and uncertain trade developments.
- Worries persist about global demand due to US-China trade tension.
- Reports suggest potential OPEC+ output increases in June.
- Progress in US-Iran nuclear talks raises supply concerns.
Technical Overview

Exponential Moving Averages (EMA)
- EMA 10: 62.48 – Negative Crossover (Bearish)
- EMA 20: 63.45 – Negative Crossover (Bearish)
- EMA 50: 65.99 – Negative Crossover (Bearish)
Simple Moving Averages (SMA)
- SMA 10: 62.64 – Negative Crossover (Bearish)
- SMA 20: 63.12 – Negative Crossover (Bearish)
- SMA 50: 66.50 – Negative Crossover (Bearish)
Indicators
- RSI: 39.73 – Sell Zone (Bearish)
- Stochastic Oscillator: 71.12 – Sell Zone (Neutral)
Support and Resistance Levels
- Resistance: R1: 71.99 | R2: 73.55
- Support: S1: 66.94 | S2: 65.38
Outlook
- Overall Sentiment: Bearish
- Market Direction: Sell
- Trade Suggestion:
- Limit Sell: 62.28
- Take Profit: 58.50
- Stop Loss: 65.67
Natural Gas (NGAS): Breaks Above Channel, Signaling Reversal Potential
Market Overview
Natural gas prices surged above $3.335, breaking through a descending channel and signaling a possible shift in trend momentum.
- Breakout above key resistance and 50-day EMA confirms bullish breakout.
- Price now finds immediate support at the former resistance level of $3.316.
- The next major barrier is the 200-day EMA at $3.486.
Technical Overview
Exponential Moving Averages (EMA)
- EMA 10: 3.202 – Positive Crossover (Bullish)
- EMA 20: 3.378 – Negative Crossover (Bearish)
- EMA 50: 3.623 – Negative Crossover (Bearish)
Simple Moving Averages (SMA)
- SMA 10: 3.144 – Positive Crossover (Bullish)
- SMA 20: 3.423 – Negative Crossover (Bearish)
- SMA 50: 3.869 – Negative Crossover (Bearish)
Indicators
- RSI: 39.98 – Sell Zone (Bearish)
- Stochastic Oscillator: 27.99 – Sell Zone (Neutral)
Support and Resistance Levels
- Resistance: R1: 4.77 | R2: 5.07
- Support: S1: 3.78 | S2: 3.48
Outlook
- Overall Sentiment: Bearish
- Market Direction: Sell
- Trade Suggestion:
- Limit Sell: 3.45
- Take Profit: 2.98
- Stop Loss: 3.84
Commodity Price Snapshot (As of Report Time)
- Gold: Down 0.92% at $3,313.92
- Silver: Up 0.41% at $33.26
- Palladium: Down 0.20% at $945.81
- Platinum: Up 0.11% at $990.61
- Brent Crude Oil: Down 1.10% at $63.81
- WTI Crude Oil: Down 1.18% at $61.14
Key Economic Events Today (USD)
- CB Consumer Confidence (Apr):
- Forecast: 87.7 | Previous: 92.9 | Time: 19:30
- JOLTS Job Openings (Mar):
- Forecast: 7.490M | Previous: 7.568M | Time: 19:30