Gold and silver remain supported by a weakening U.S. Dollar and renewed trade tensions, while crude oil and natural gas face downward pressure amid supply-related concerns. As traders await clarity on Federal Reserve policy and monitor geopolitical risks, market participants are maintaining a cautious stance ahead of key technical and macroeconomic developments.
KEY HIGHLIGHTS
- Gold Holds Above $3,300 As Dollar Weakens, Trade Uncertainty Grows
- Silver Finds Support Above $33 Despite Minor Profit-Taking Pressure
- Crude Oil Faces Pressure From Potential OPEC+ Output Increase
- Natural Gas Slumps Below $3 As Sellers Maintain Bearish Grip
Daily Commodity Market Report
Overview
Gold and silver remain supported by a weakening U.S. Dollar and renewed trade tensions, while crude oil and natural gas face downward pressure amid supply-related concerns. As traders await clarity on Federal Reserve policy and monitor geopolitical risks, market participants are maintaining a cautious stance ahead of key technical and macroeconomic developments.
Markets in Focus Today
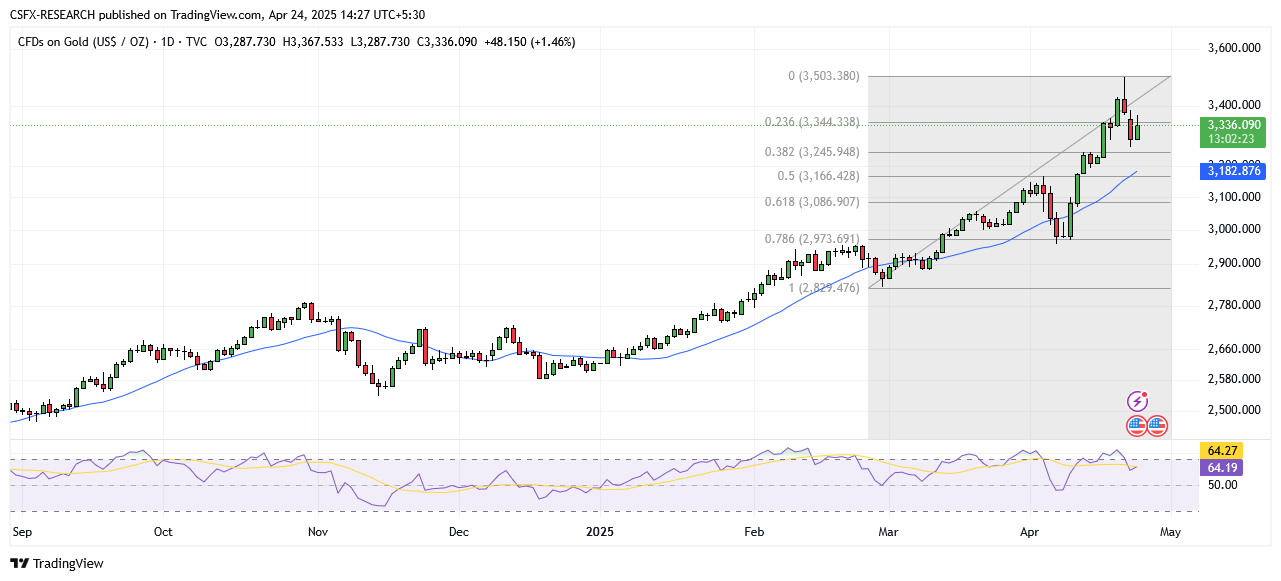
GOLD (XAU/USD) – Bullish Momentum Holds Above $3,300
Fundamental Analysis
Gold continues to trade with a bullish bias, holding firmly above the $3,300 mark in early European trading. The following factors are supporting the upside:
- Weakening U.S. Dollar
- Renewed U.S.-China trade tensions
- Expectations of aggressive Federal Reserve rate cuts
- Safe-haven demand amid global economic uncertainty
However, lingering hopes of a trade resolution and reduced concerns over Federal Reserve independence are keeping risk sentiment positive, which may cap further gains in the near term.
Technical Overview

Moving Averages
Exponential Moving Averages:
- MA 10: 3284.22 – Bullish
- MA 20: 3207.06 – Bullish
- MA 50: 3066.84 – Bullish
Simple Moving Averages:
- MA 10: 3294.72 – Bullish
- MA 20: 3182.92 – Bullish
- MA 50: 3041.69 – Bullish
Oscillators
- RSI: 64.24 – Buy Zone
- Stochastic Oscillator: 69.58 – Neutral
Support and Resistance Levels
- Resistance: R1: 3139.50 | R2: 3203.71
- Support: S1: 2931.64 | S2: 2867.44
Market Sentiment
- Overall Sentiment: Bullish
- Market Direction: Buy
Trade Suggestion
- Entry: Limit Buy at 3307.70
- Take Profit: 3388.50
- Stop Loss: 3269.50
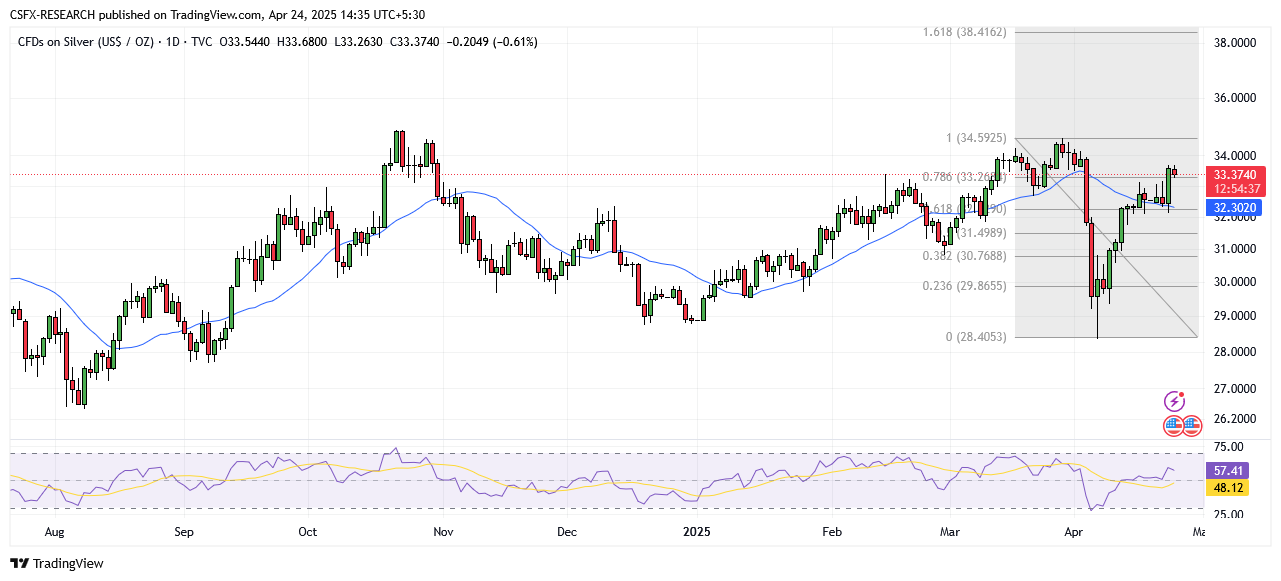
SILVER (XAG/USD) – Holding Above Key $33.00 Support
Fundamental Analysis
Silver is witnessing a mild pullback after testing a nearly three-week high at $33.70. Despite the decline, the technical setup favors a continuation of the bullish trend, as:
- Breakout from consolidation supports upward momentum
- $33.00 now acts as a strong support level
- Daily oscillators remain favorable for buyers
A sustained break above $33.70 could trigger a run toward $34.00 and beyond. On the downside, a fall below $33.00 may invite selling pressure toward $32.10.
Technical Overview

Moving Averages
Exponential Moving Averages:
- MA 10: 32.52 – Bullish
- MA 20: 32.37 – Bullish
- MA 50: 31.50 – Bullish
Simple Moving Averages:
- MA 10: 32.64 – Bullish
- MA 20: 32.51 – Bullish
- MA 50: 31.80 – Bullish
Oscillators
- RSI: 56.78 – Buy Zone
- Stochastic Oscillator: 89.81 – Positive
Support and Resistance Levels
- Resistance: R1: 33.69 | R2: 34.52
- Support: S1: 32.82 | S2: 31.87
Market Sentiment
- Overall Sentiment: Bullish
- Market Direction: Buy
Trade Suggestion
- Entry: Limit Buy at 32.94
- Take Profit: 34.16
- Stop Loss: 32.28
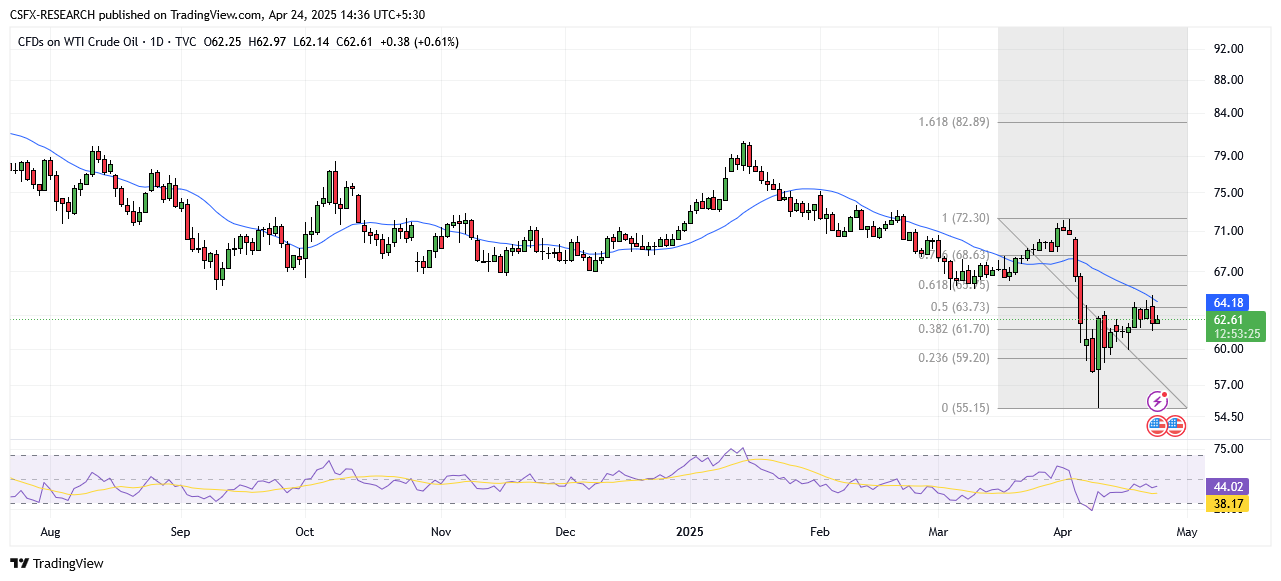
CRUDE OIL (WTI) – Pressured by Supply Concerns
Fundamental Analysis
WTI crude rebounded slightly to $62.20 per barrel during the Asian session but remains under pressure due to:
- Potential increase in OPEC+ supply
- Kazakhstan’s inability to reduce domestic output
- Bearish sentiment following a 2% drop on Wednesday
- Mixed developments regarding U.S.-China trade talks
- Rising geopolitical risks from U.S.-Iran tensions
Technical Overview

Moving Averages
Exponential Moving Averages:
- MA 10: 62.94 – Bearish
- MA 20: 63.96 – Bearish
- MA 50: 66.49 – Bearish
Simple Moving Averages:
- MA 10: 62.34 – Bullish
- MA 20: 64.33 – Bearish
- MA 50: 67.04 – Bearish
Oscillators
- RSI: 43.33 – Neutral Zone
- Stochastic Oscillator: 52.78 – Neutral
Support and Resistance Levels
- Resistance: R1: 71.99 | R2: 73.55
- Support: S1: 66.94 | S2: 65.38
Market Sentiment
- Overall Sentiment: Bearish
- Market Direction: Sell
Trade Suggestion
- Entry: Limit Sell at 63.61
- Take Profit: 61.41
- Stop Loss: 65.27
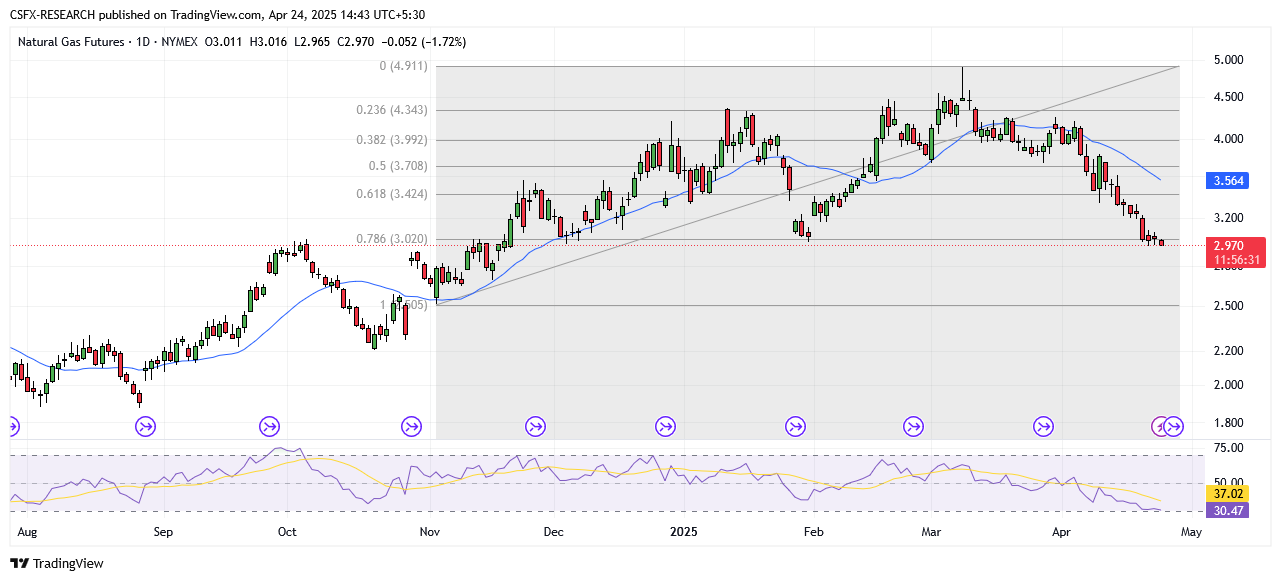
NATURAL GAS – Under Pressure Below Key Levels
Fundamental Analysis
Natural gas remains weak, trading below the $3.00 level as it nears critical support. Key bearish signals include:
- Price capped by $3.053 resistance and 50-day EMA
- Sellers dominant below descending trendline
- Break below $2.957 may extend the decline to $2.887
A decisive move above $3.053 would be needed to shift the trend bullish and target $3.137. Until then, downside bias remains intact.
Technical Overview

Moving Averages
Exponential Moving Averages:
- MA 10: 3.2307 – Bearish
- MA 20: 3.4542 – Bearish
- MA 50: 3.6825 – Bearish
Simple Moving Averages:
- MA 10: 3.2348 – Bearish
- MA 20: 3.5547 – Bearish
- MA 50: 3.9090 – Bearish
Oscillators
- RSI: 29.22 – Sell Zone
- Stochastic Oscillator: 4.18 – Neutral
Support and Resistance Levels
- Resistance: R1: 4.77 | R2: 5.07
- Support: S1: 3.78 | S2: 3.48
Market Sentiment
- Overall Sentiment: Bearish
- Market Direction: Sell
Trade Suggestion
- Entry: Limit Sell at 3.13
- Take Profit: 2.82
- Stop Loss: 3.33
Other Commodity Moves
- Gold: Up 1.51% at $3,337.59
- Silver: Down 0.70% at $33.34
- Palladium: Up 0.13% at $938.79
- Platinum: Up 0.29% at $976.99
- Brent Crude Oil: Down 0.91% at $65.54
- WTI Crude Oil: Up 0.58% at $62.62
Key Economic Events Today
- (USD) Initial Jobless Claims
- Forecast: 222K
- Previous: 215K
- Time: 18:00
- (EUR) ECB’s Lane Speech
- Time: 18:30
- (EUR) Existing Home Sales (Mar)
- Forecast: 4.14M
- Previous: 4.26M
- Time: 19:30


